- Using dashboards
- Managing alerts across Cylance Endpoint Security services
- Managing users, devices, and groups
- Manage CylancePROTECT Desktop and CylanceOPTICS devices
- Manage zones
- Manage devices with the CylancePROTECT Mobile app
- Manage CylancePROTECT Mobile app and CylanceGATEWAY users
- View CylanceAVERT user details
- Manage user groups
- Configure device lifecycle management
- View a list of applications installed on CylancePROTECT Desktop devices
- Remove a registered FIDO device for a user account
- Discover unprotected devices
- Managing threats detected by CylancePROTECT Desktop
- Managing safe and unsafe lists for CylancePROTECT Desktop and CylancePROTECT Mobile
- Add a file to the CylancePROTECT Desktop global quarantine or global safe list
- Add a file to the CylancePROTECT Desktop local quarantine or local safe list
- Add a certificate to the CylancePROTECT Desktop global safe list
- Add an app, certificate, IP address, domain, or installer source to the CylancePROTECT Mobile safe or restricted list
- Analyzing data collected by CylanceOPTICS
- Using CylanceOPTICS to detect and respond to events
- Auditing administrator actions
- Managing logs
- Send events to a SIEM solution or syslog server
- Enable access to the Cylance User API
- Troubleshooting Cylance Endpoint Security
- Using the BlackBerry Support Collection Tool
- Using the Report a problem feature
- Removing the BlackBerry Connectivity Node software from Cylance Endpoint Security
- Troubleshooting CylancePROTECT Desktop
- Remove the CylancePROTECT Desktop agent from a device
- Re-register a Linux agent
- Troubleshoot update, status, and connectivity issues with CylancePROTECT Desktop
- A large number of DYLD Injection violations are reported by Linux devices
- Time zone variances for CylancePROTECT Desktop
- Folder exclusions when using CylancePROTECT Desktop with third-party security products
- Linux driver is not loaded. Upgrade the driver package.
- Troubleshooting CylanceOPTICS
- Managing threats detected by CylancePROTECT Mobile
- View mobile OS vulnerabilities
- Monitoring network connections with CylanceGATEWAY
- Monitoring sensitive files with CylanceAVERT
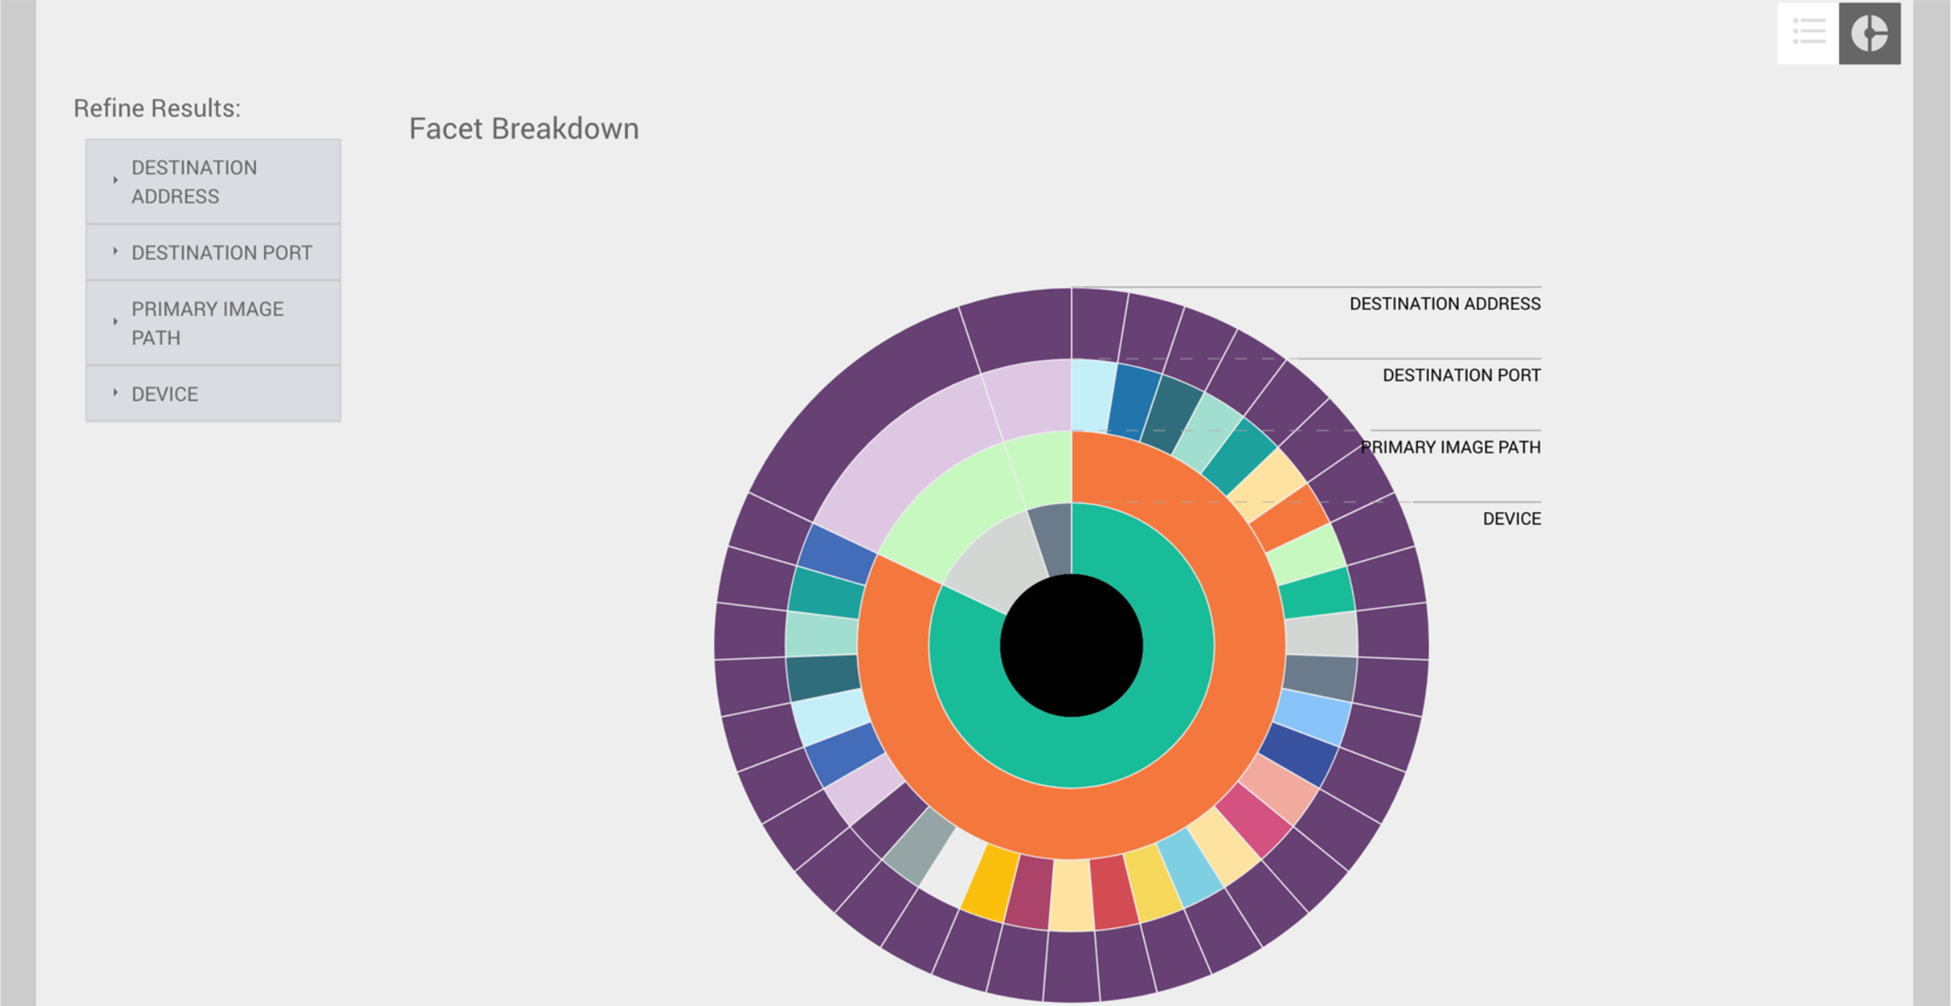
Using the InstaQuery facet breakdown
The InstaQuery facet breakdown provides an interactive visual display of the different facets involved in a query so that you can identify and follow their relational paths.
The sunburst model of the facet breakdown is useful for identifying suspicious activity in a given dataset. For example, if you try to find suspicious network connections across an environment or multiple zones, data patterns and anomalies can be difficult to pinpoint because of the volume and complexity of the data. The following images demonstrate how you can view and filter data in the facet breakdown to quickly locate suspicious activity.
The following images were generated by creating an InstaQuery to search for connections to a specific IP address. The results of the query were visualized into a sunburst diagram with these facets: device, primary image path, destination port, and destination address.
You can hover over any of the facets to display their associated values. In the following image, the administrator selected the outermost facet to view the name of the device, the path to the file that initiated the network connection, the port number used for the connection, and the IP address of the remote system.
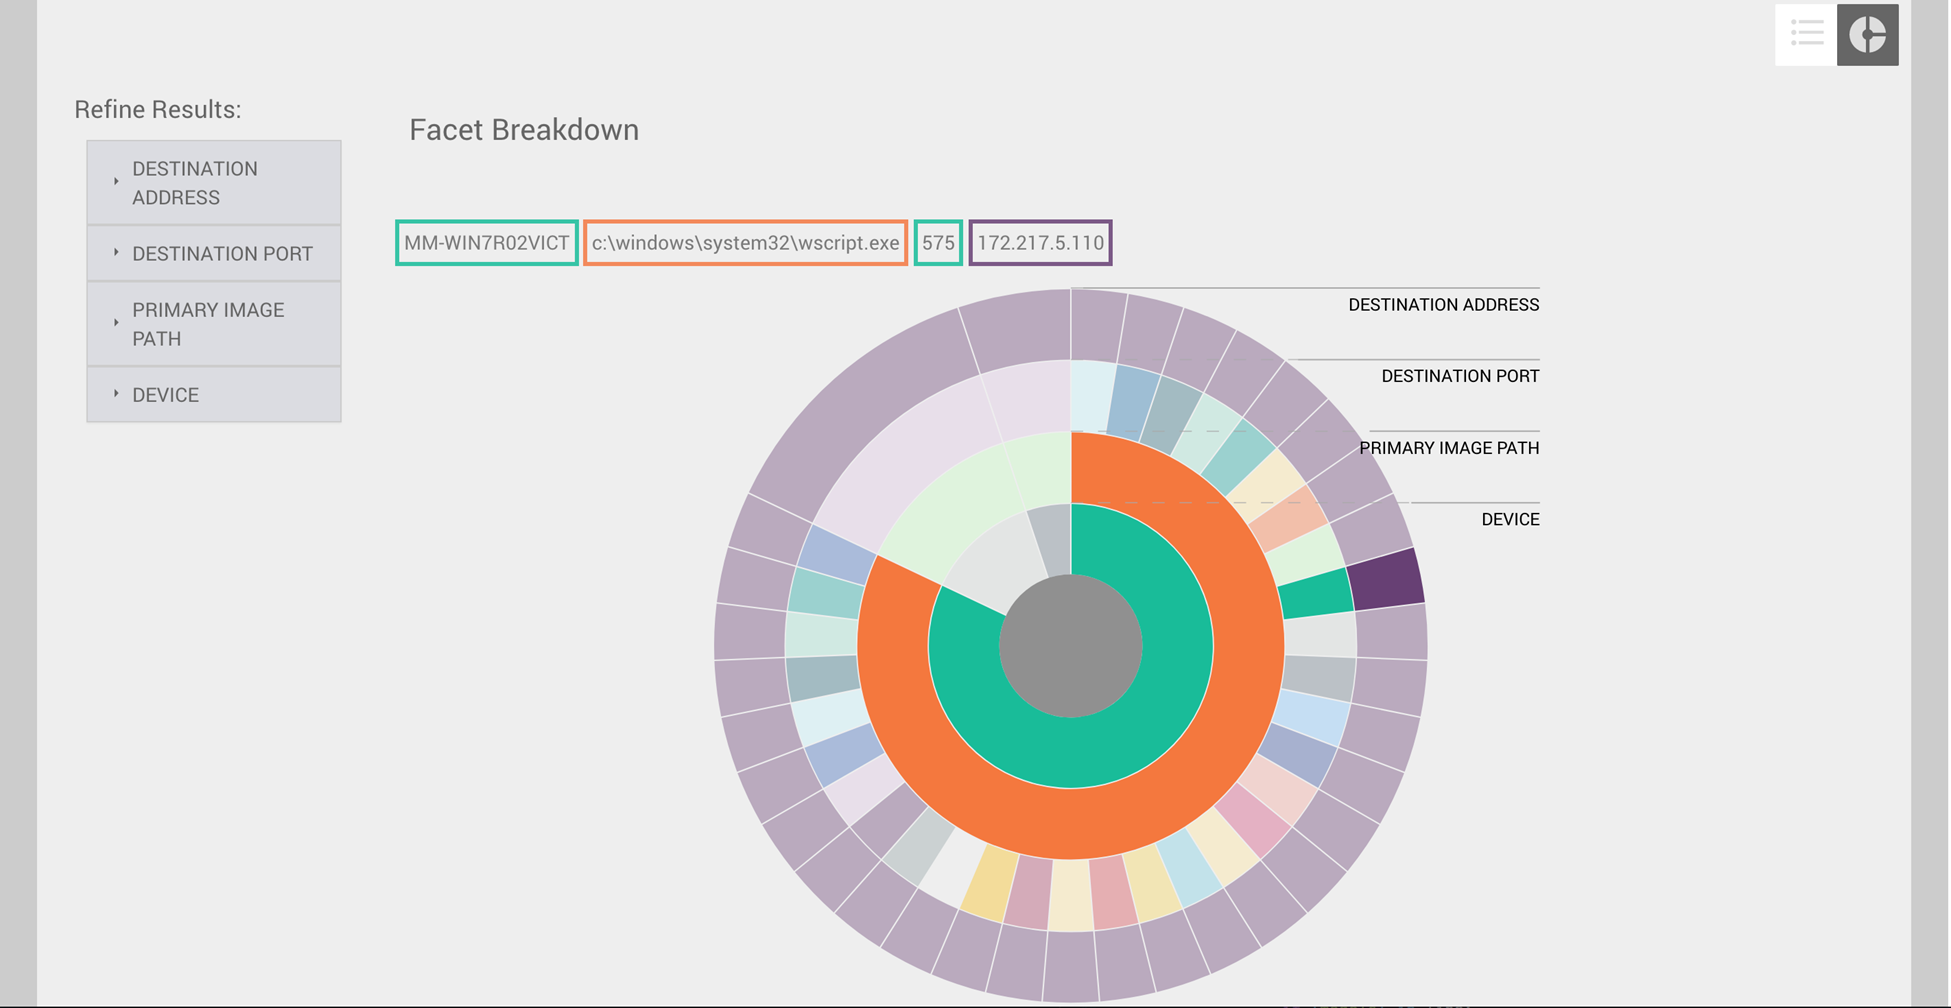
When you hover over a facet, the associated parent facets are also highlighted to help you draw a visual relationship between the data points. In the example above, you can see that one device and one parent process were responsible for most connections to the IP address. The diagram also illustrates that many different network ports were used to connect to this IP address from the associated host, something that differs from the other two host facets in the diagram.
You can also obtain useful information from the refine results menus. Each of the facet menus contains the unique values and the number of occurrences for each facet. In the example below, you can see that there are two processes that were responsible for connections to this IP address:
Google
Chrome
and Wscript.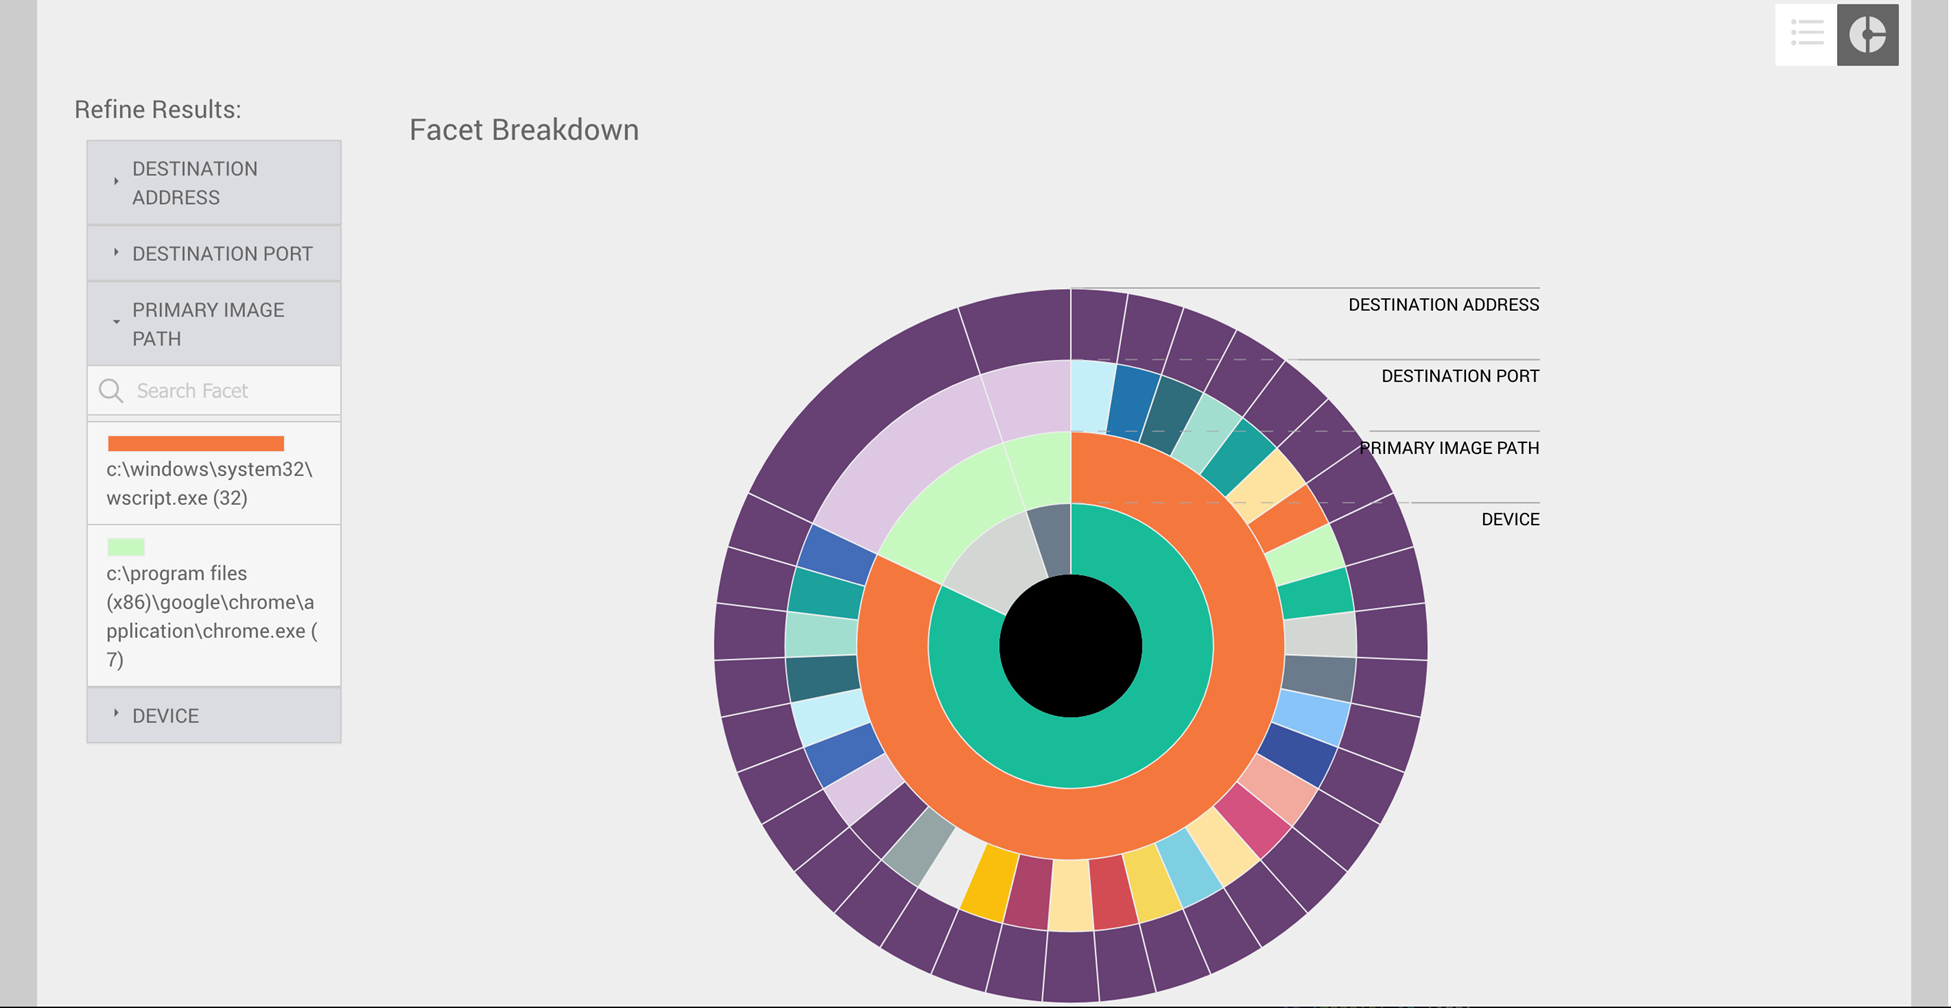
When you click a facet value in the refine results menu, the diagram will change to display the facets that are directly related. This feature is useful to filter out irrelevant data and allow for a more focused analysis.