Managing CylanceMDR incidents in the Cylance Multi-Tenant Console
CylanceMDR
incidents in the Cylance
Multi-Tenant Console

If an organization is subscribed to
CylanceMDR
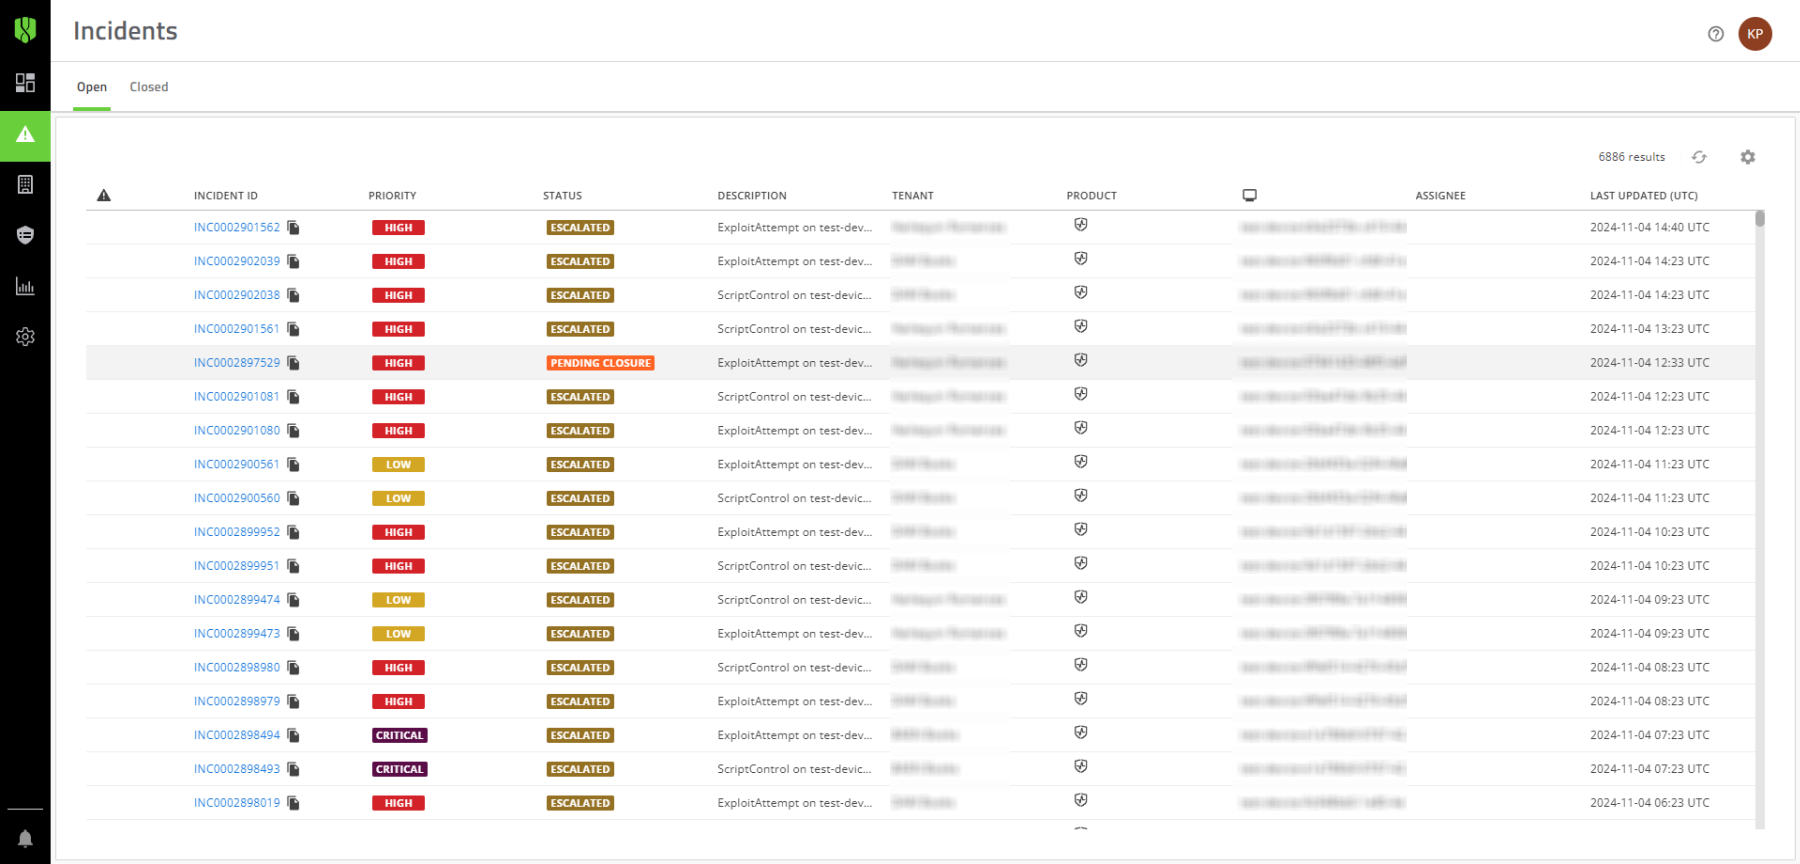
Standard, Advanced, or Pro, analysts monitor alerts for them and will escalate the alerts as incidents to them if they require attention. When an analyst identifies a threat and escalates it to an organization, designated escalation groups in the organization are notified and you can view them on the Alerts > Incidents page in the Cylance
Multi-Tenant Console
.If an organization is subscribed to
CylanceMDR
On-Demand, you must manually request CylanceMDR
support from the details screen of an alert from the Alerts page. These requests are escalated to CylanceMDR
analysts so they can investigate. You can follow up on these requests from the Alerts > Incidents page in the Cylance
Multi-Tenant Console
console.On the Incidents page, you can do the following:
- In the Open or Closed tabs, click an incident in the list to view its details.
- Click
 beside one of the columns to filter the results. For example, you can filter certain tenants.
 - Click
 to select the fields that you want to display.
 - Export the current list of incidents to a .csv file, or print it as a PDF.