Status chart
The status chart section of the Summary tab displays a timeline with two different elements on it:
White vertical bars display the total number of users targeted in the initial and all subsequent alerts. This number normally decreases over time as more users provide their statuses and are excluded from subsequent reminder alerts. The final alert is sent to all users to notify them that the event has concluded.
A green continuous line displays the total number of users over time who have provided their status. 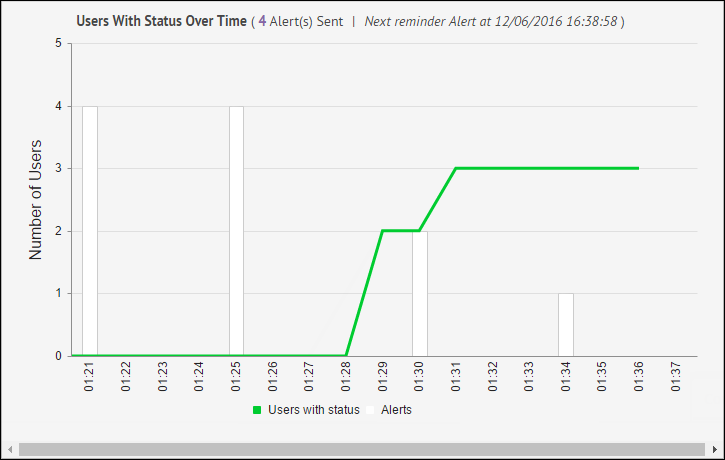
Click the number of alerts in the
Users With Status Over Time (<X> Alert(s) Sent)
title opens the Activity tab for the event. The Activity tab displays details of the original alert, ending alert (if the event has ended) and any reminder alerts that are in the queue or that have been sent.Click the corresponding text in the line below the chart to toggle the white bars and the green line can on and off individually. 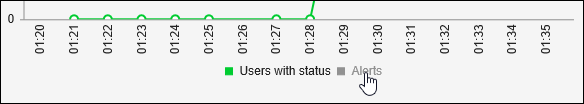
In addition to providing information on the progress of the event, the chart allows you to tell at a glance when statuses have been recorded for all users, making additional reminder alerts unnecessary. At that point, you can click
End Event
at the top of the screen. This halts all queued reminder alerts and causes an Ending Alert to be sent to all affected users.