Physical environment
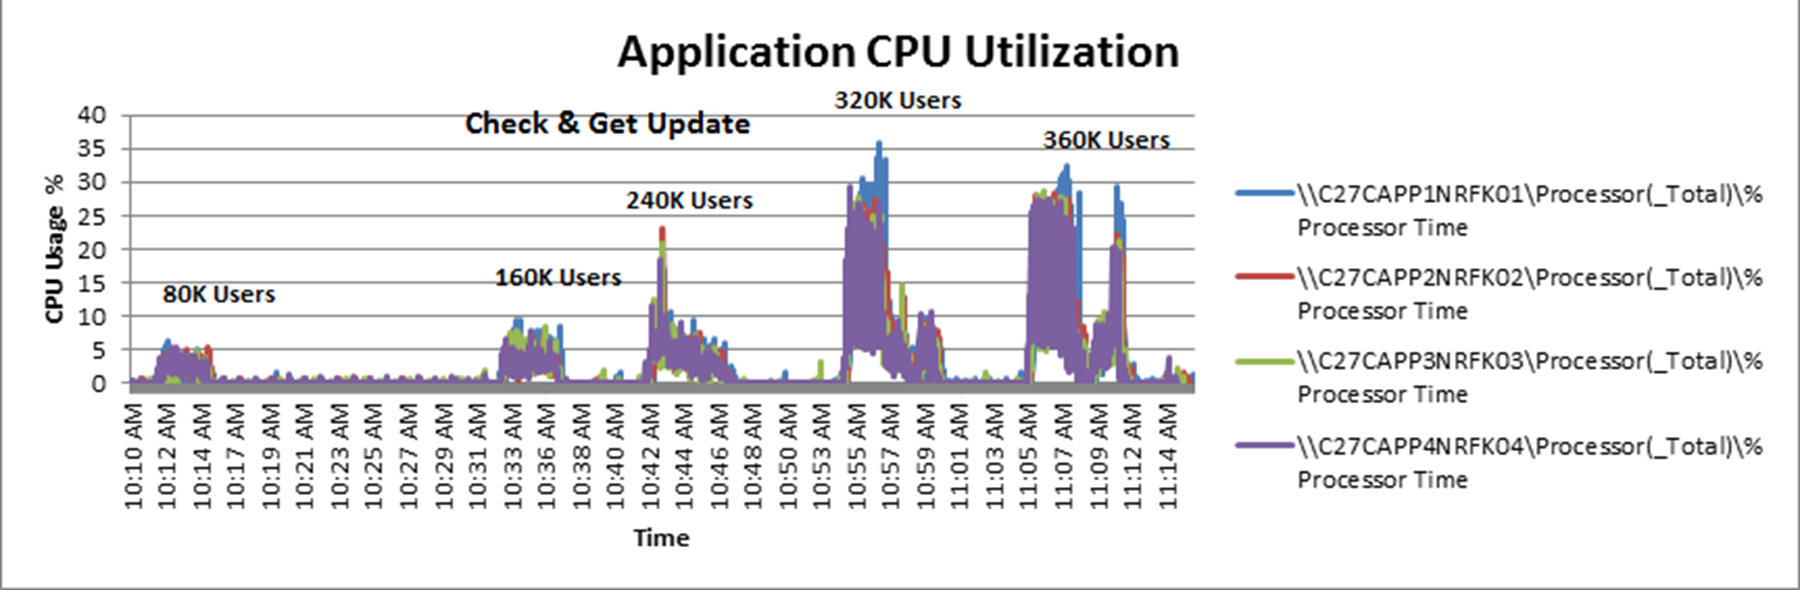
Similar metrics were collected for the tests run on servers in a physical environment. The following image shows the CPU usage for a three-server application desktop client test for different numbers of concurrent users over a three-minute polling interval.
Application CPU utilization percentage
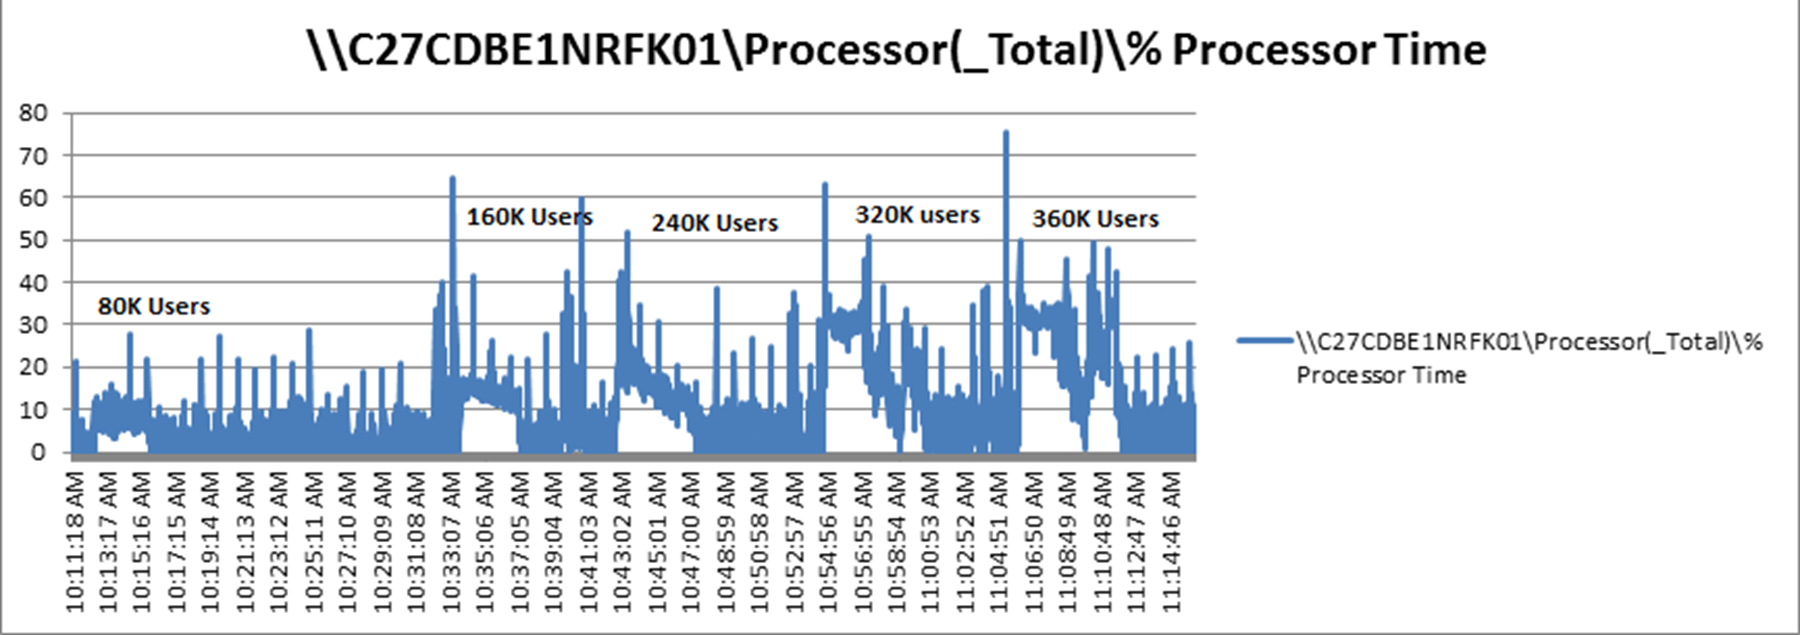
The following image shows the CPU usage on the database side.
Database CPU utilization percentage
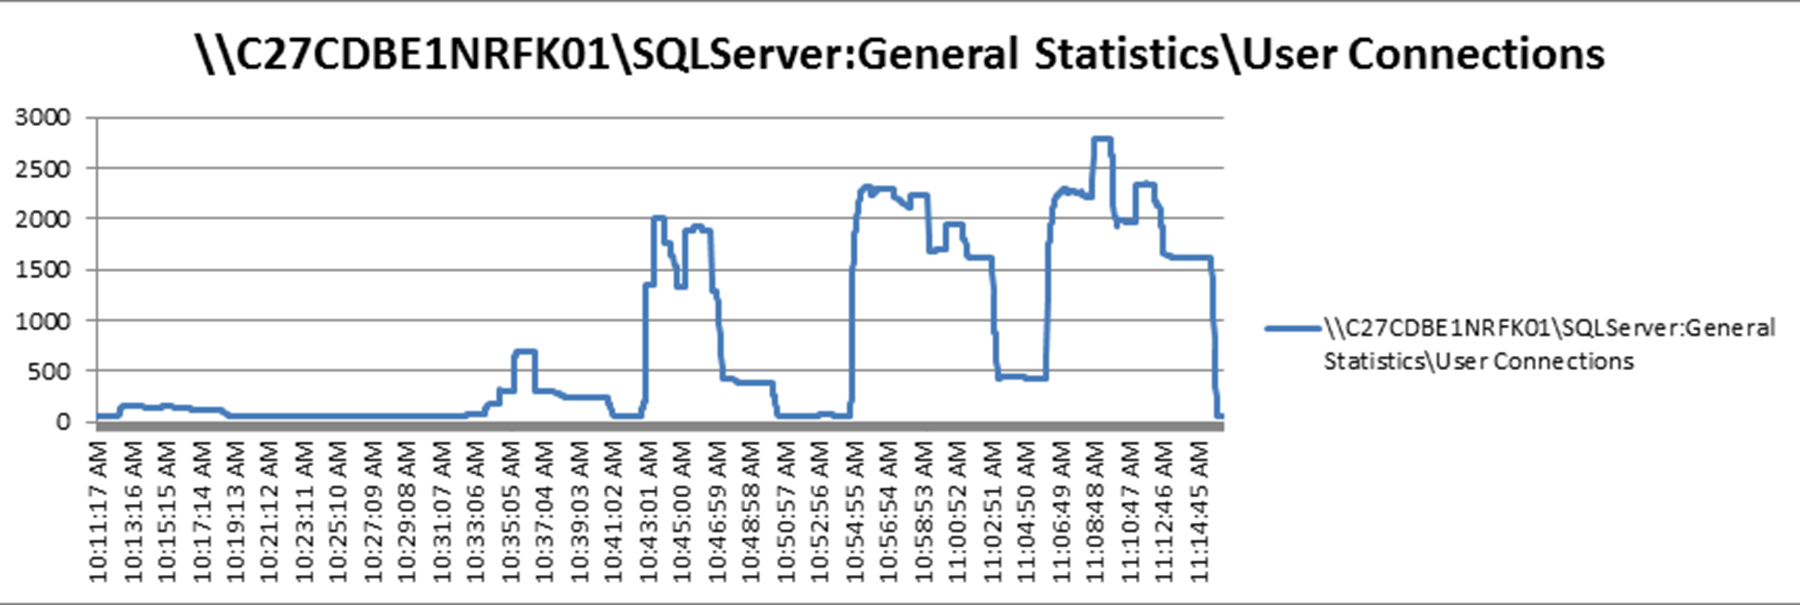
The following image shows the user connections open on the database side during the different tests.
Database user connections
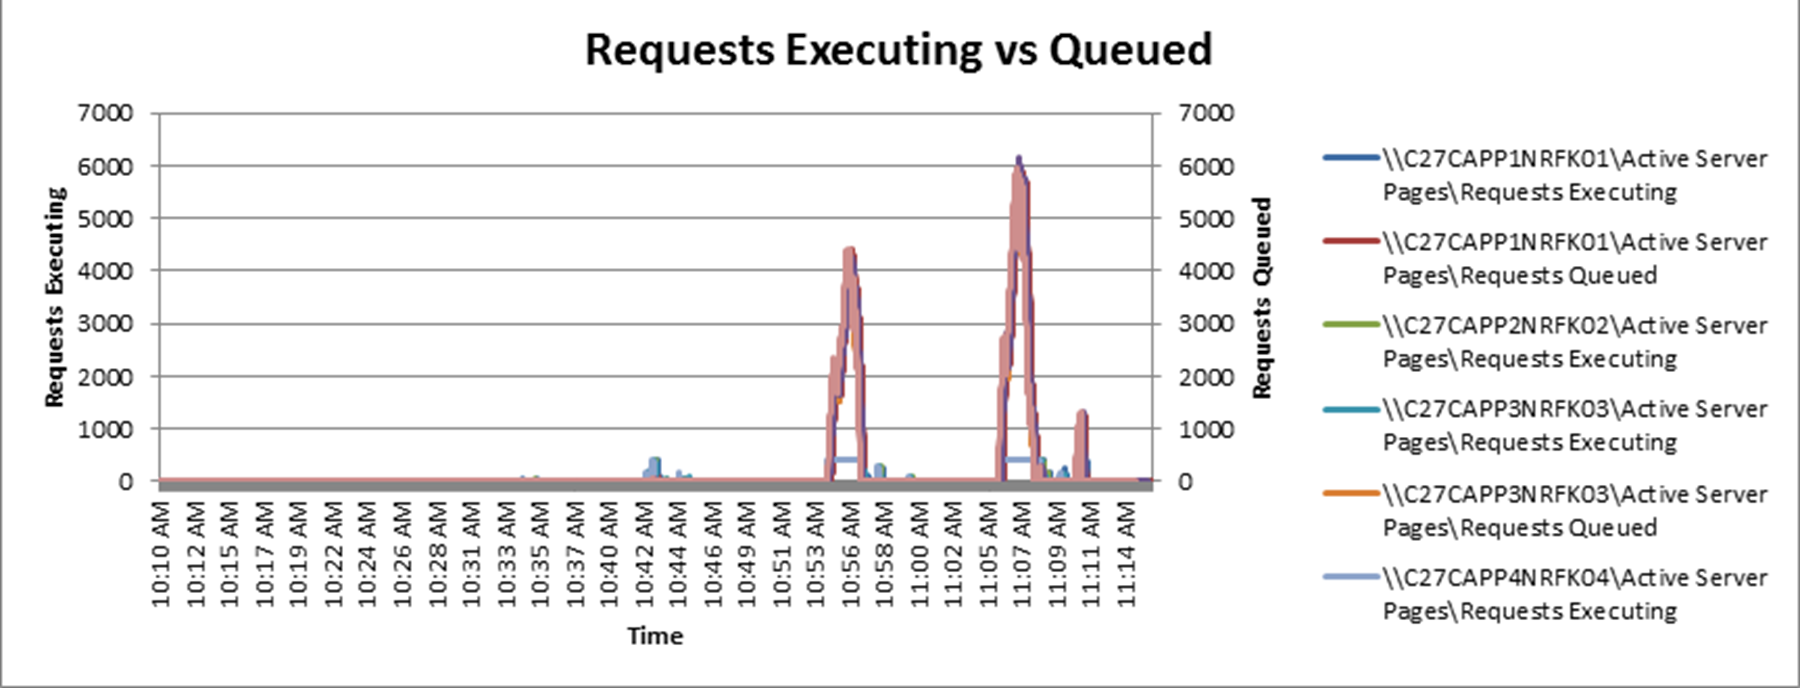
The following image shows the requests queued up on IIS as opposed to the number of requests being executed by the application at any given point of time during the tests.
Application requests executing vs requests queued