The Cylance Endpoint Security dashboards offer helpful visualizations and statistical summaries of the data collected and analyzed by different Cylance Endpoint Security services. You can create your own custom dashboards by selecting from a list of available widgets.
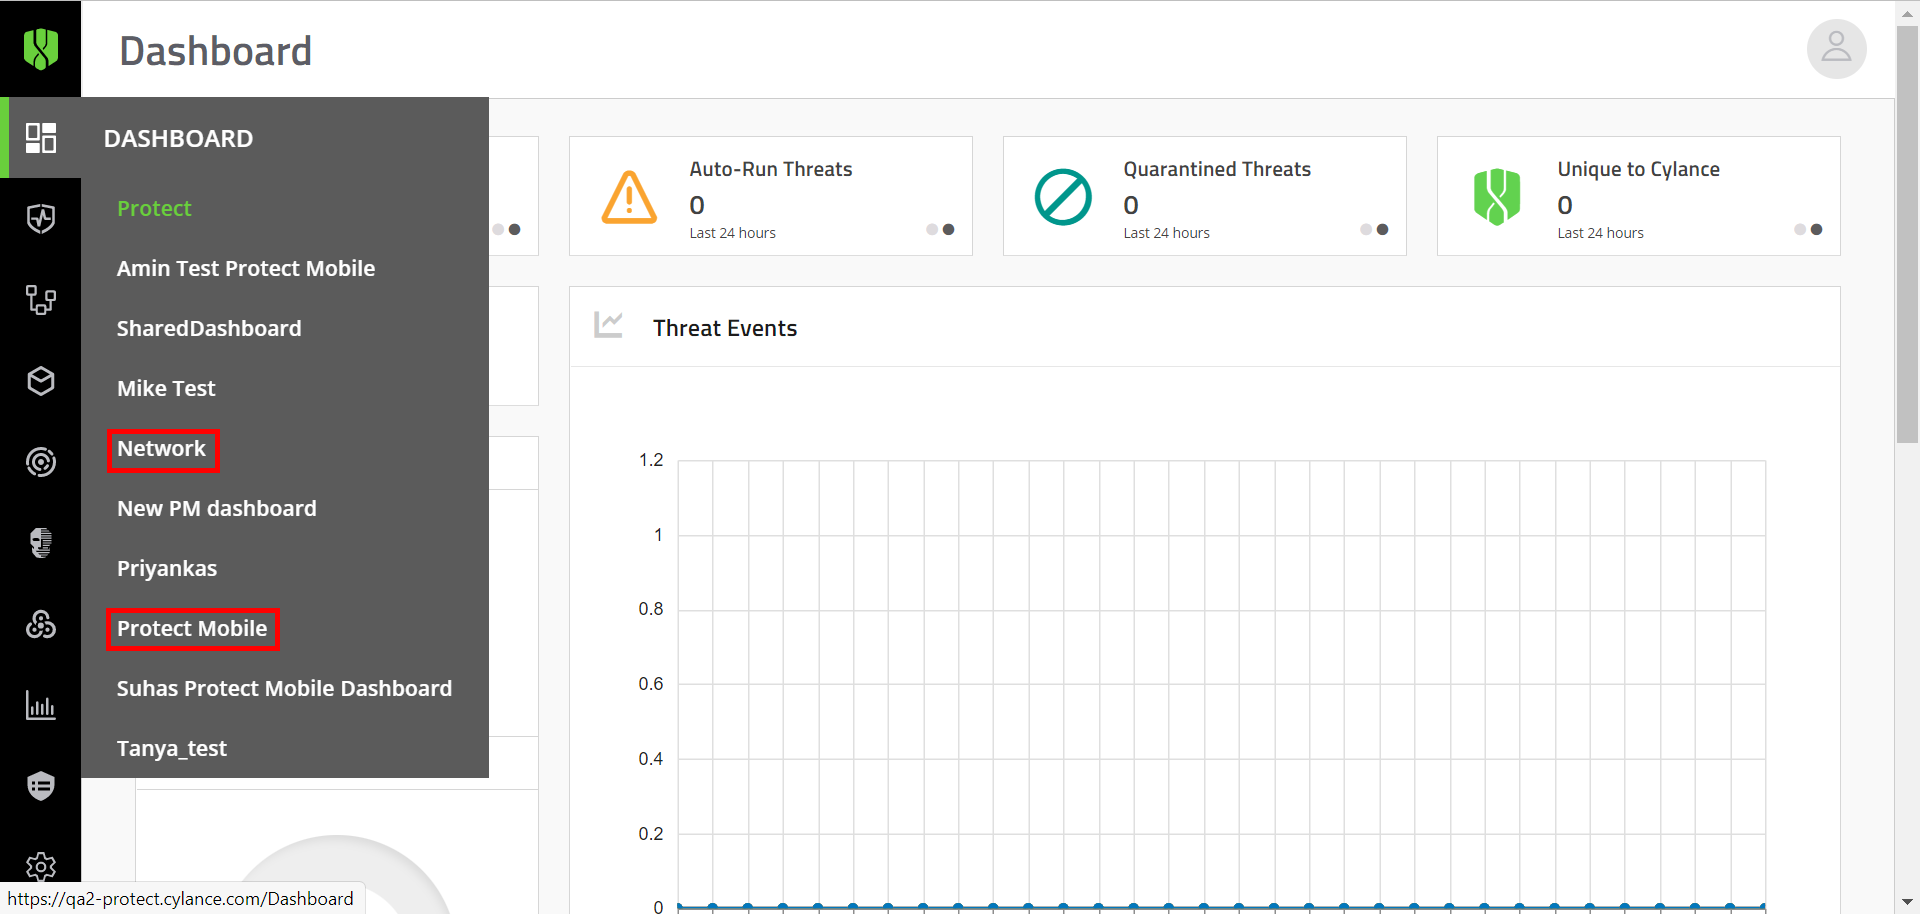
1. Go to the Mobile Protection or Network page
In the management console, on the menu bar, click Dashboard > Mobile Protection or Dashboard > Network.
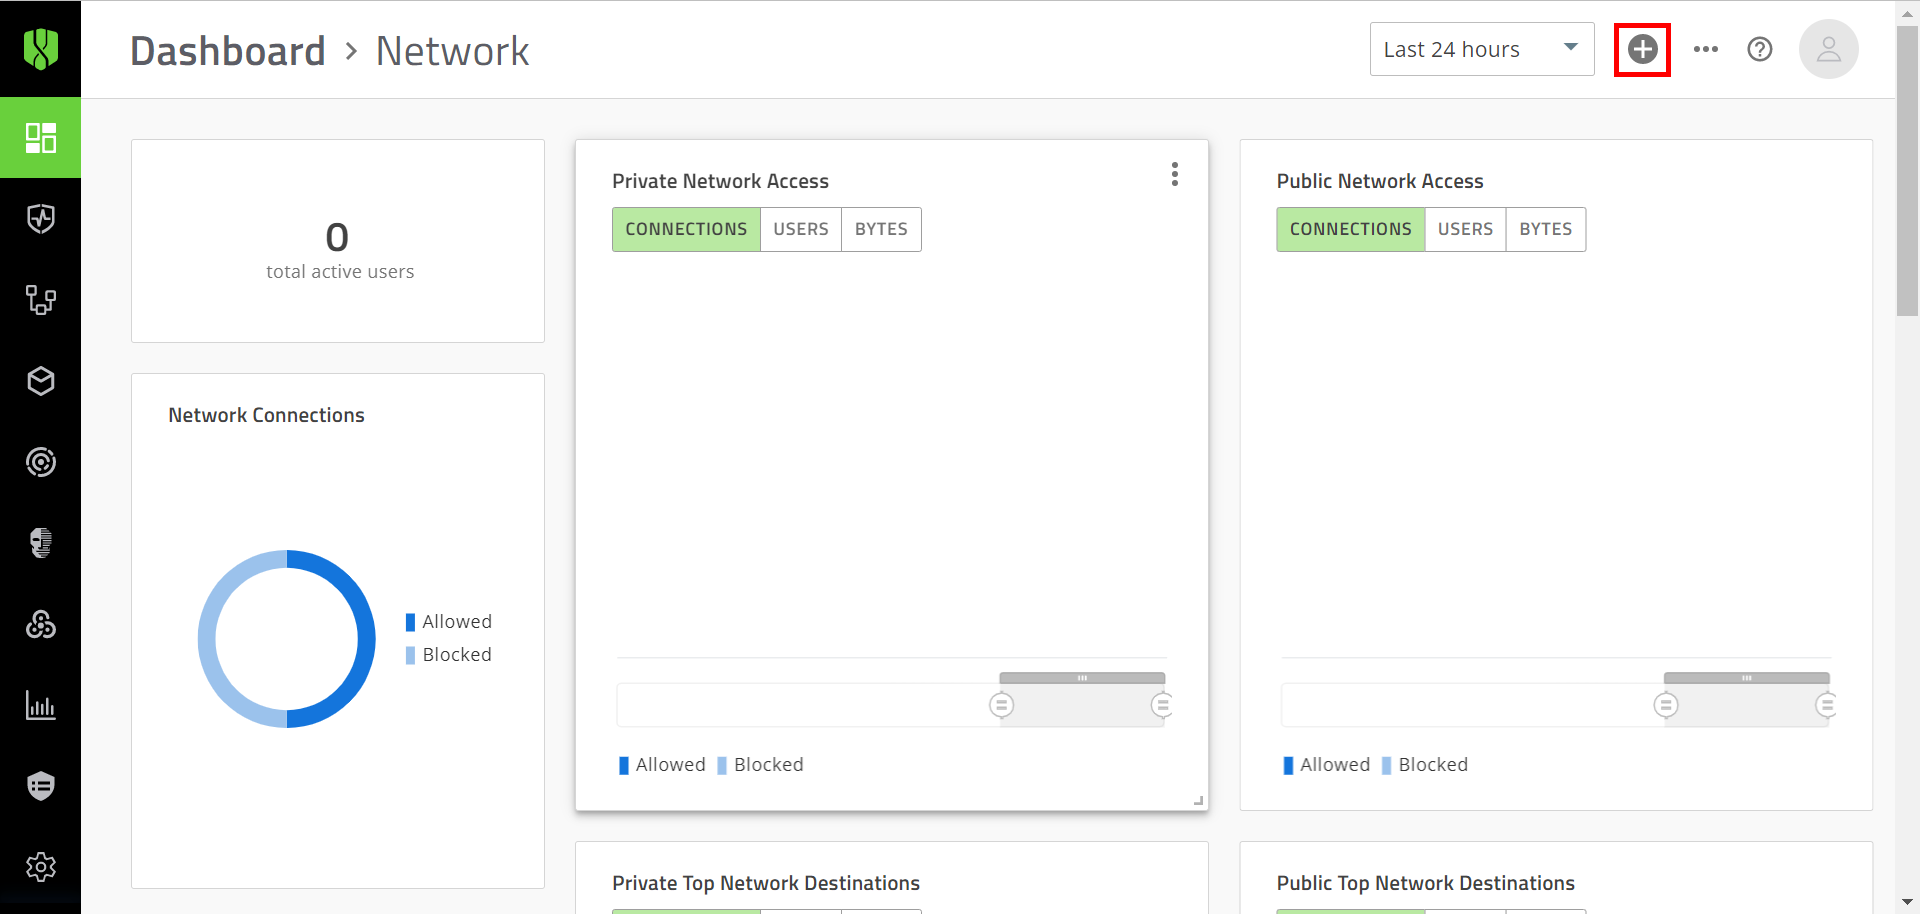
2. Click +
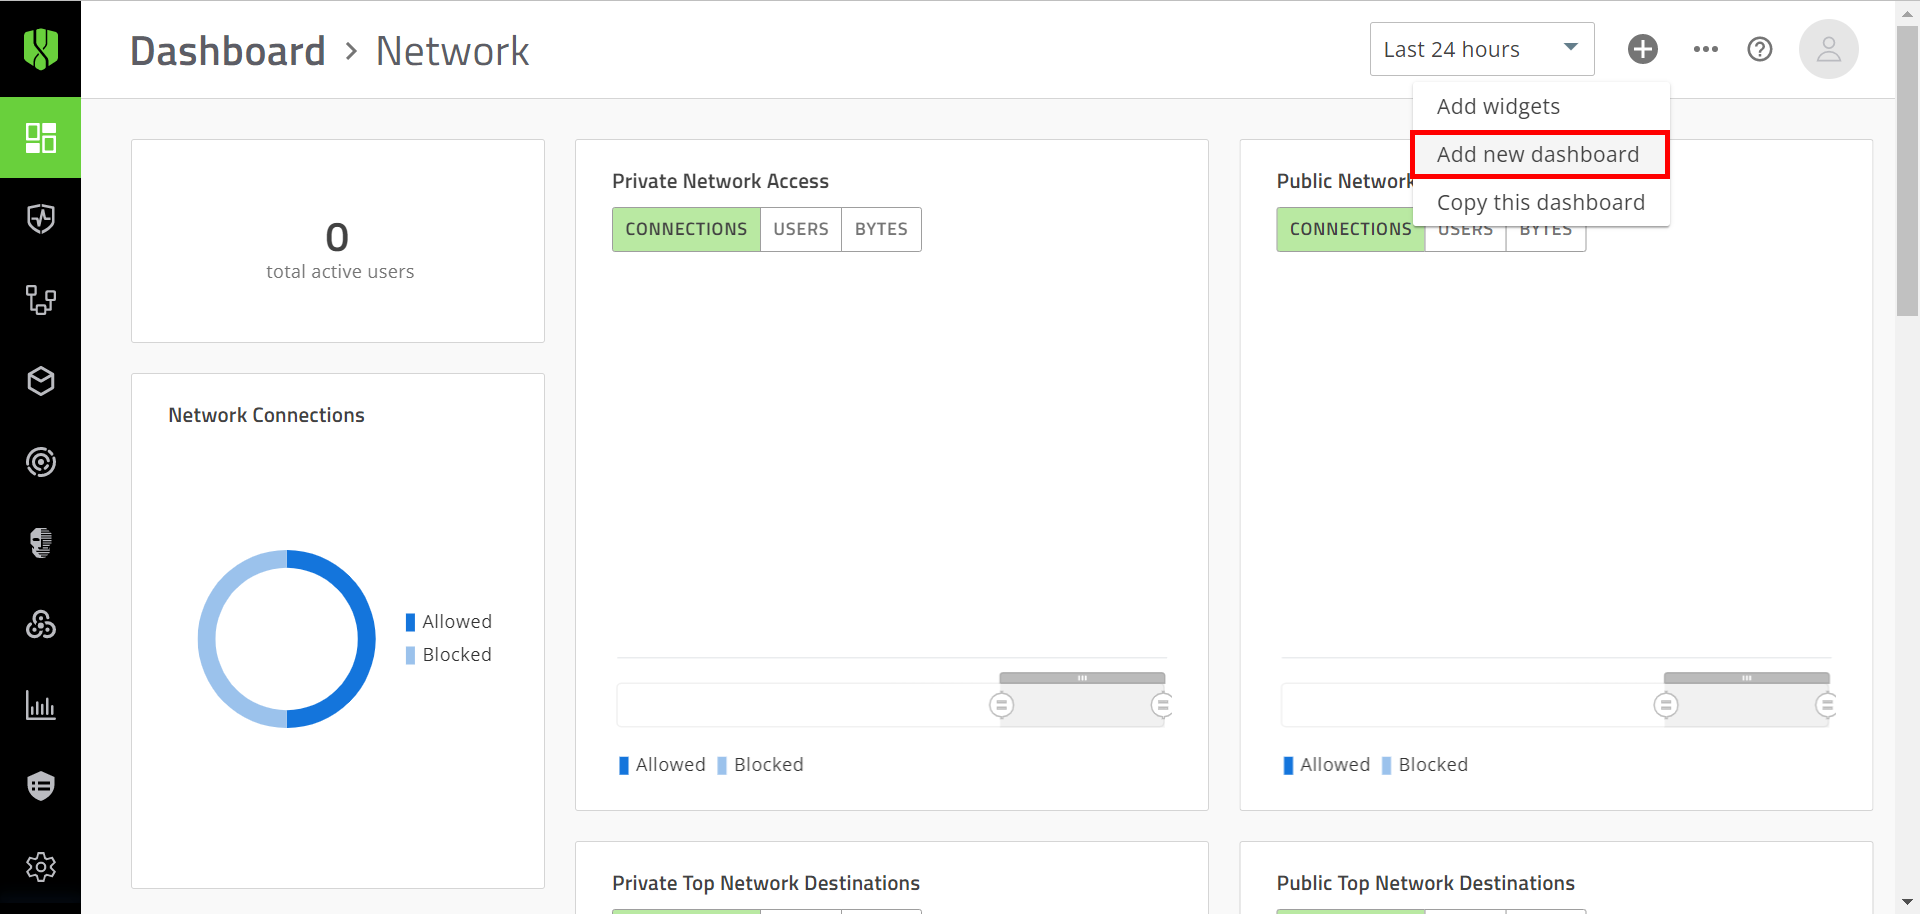
3. Click Add new dashboard
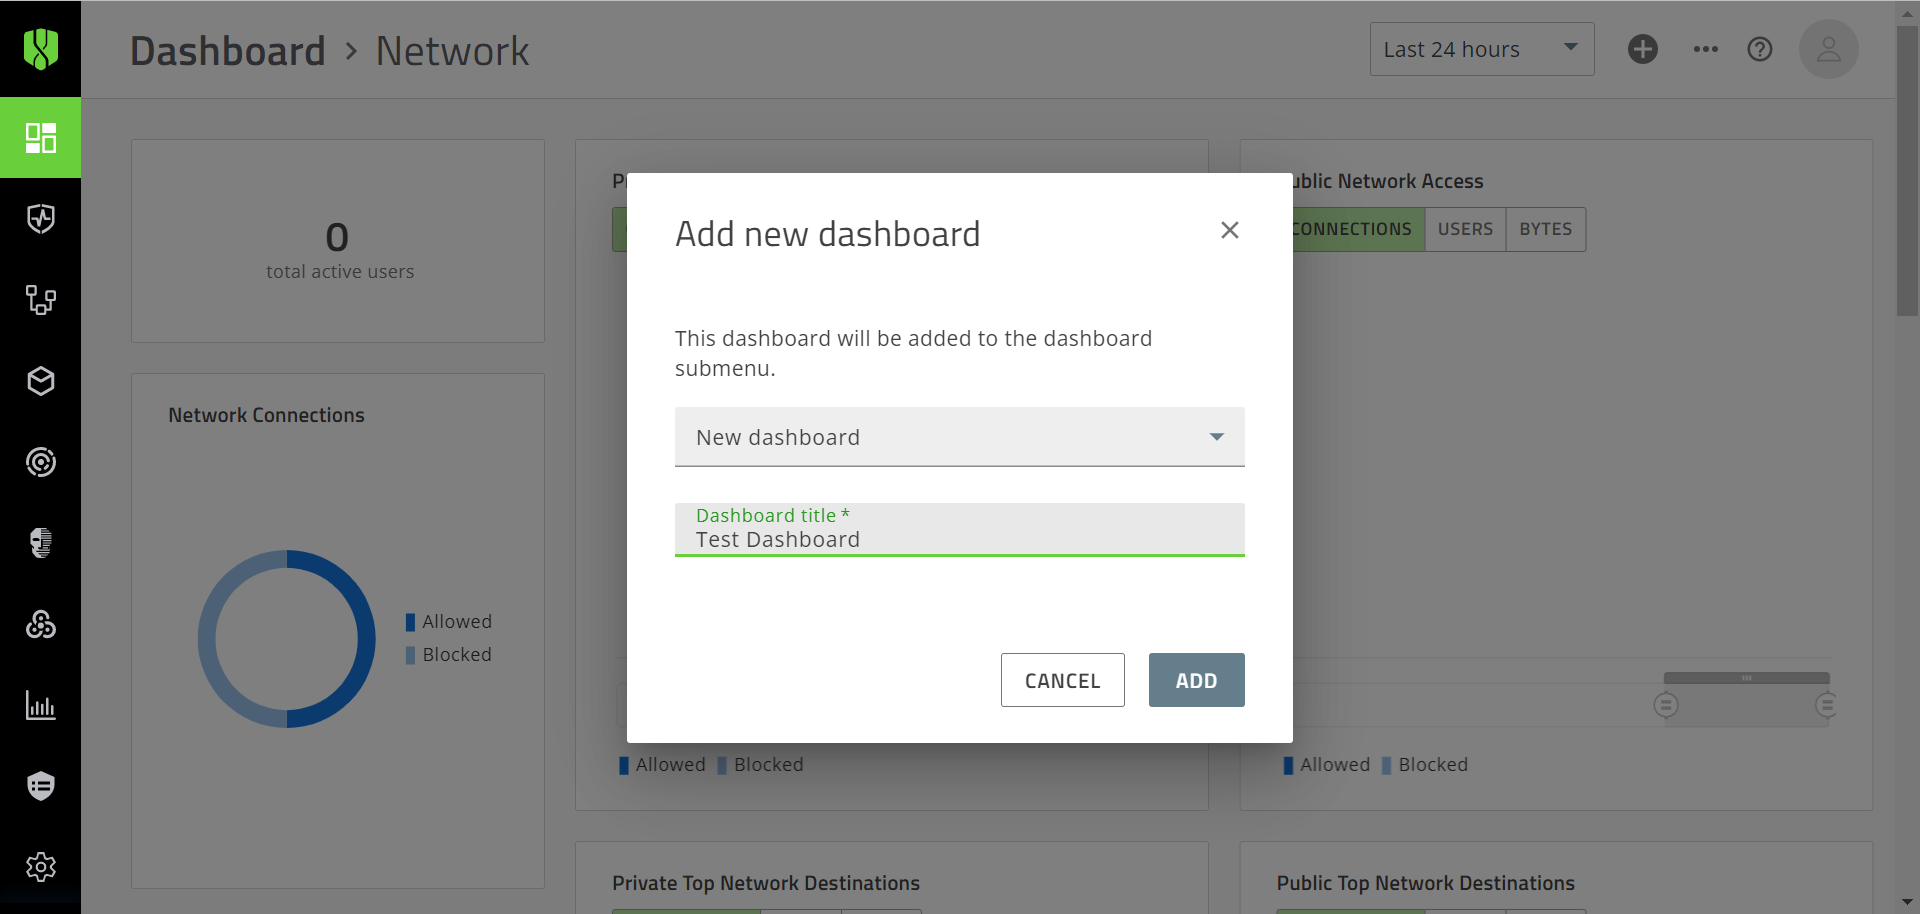
4. Set up your dashboard
If you want to start with a blank dashboard, click New dashboard. If you want the dashboard to have the default widgets from the Mobile Protection or Network dashboard, click that option.
Type a name for the dashboard and click Add.
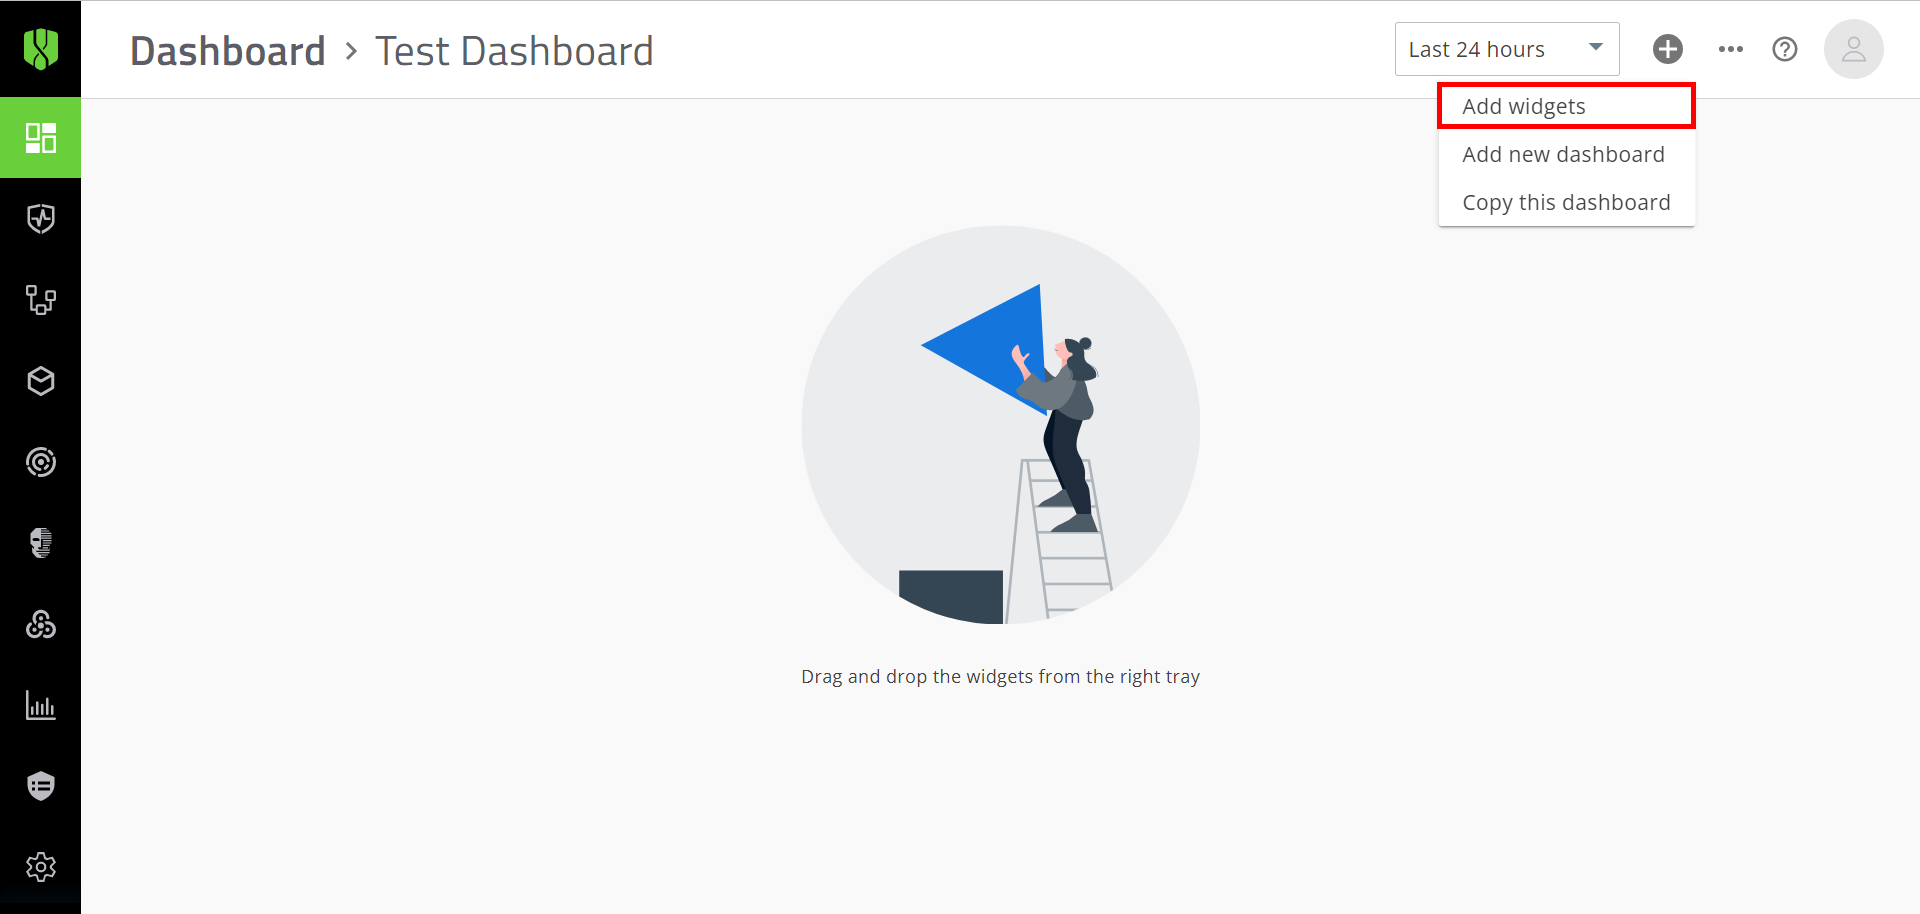
5. Click + > Add widgets
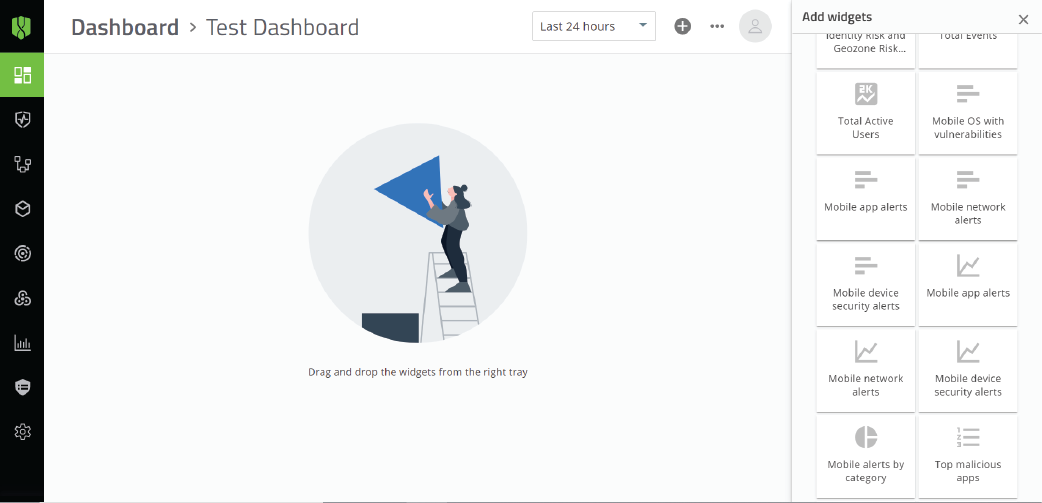
6. Explore the available widgets
From the widgets panel on the right side of the page, scroll through the widgets that you can add to your dashboard.
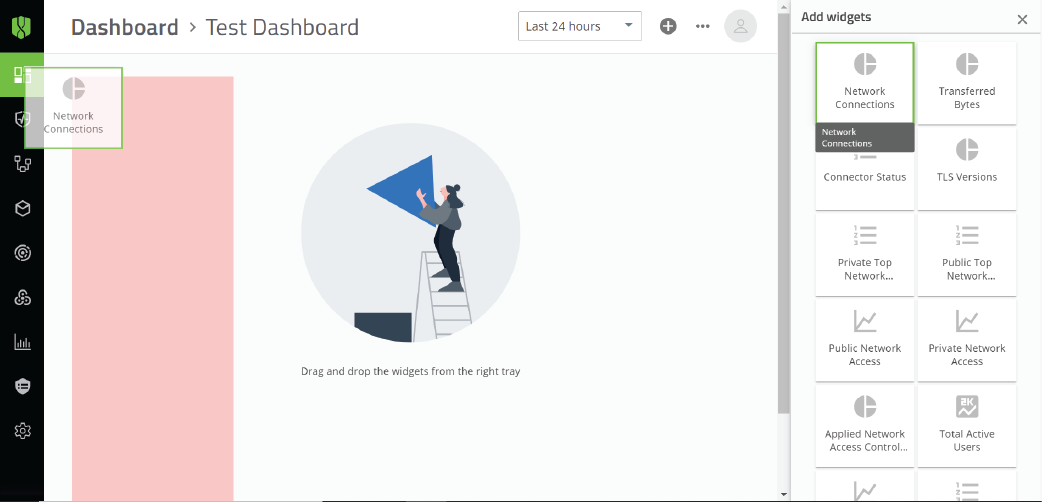
7. Drag widgets onto your dashboard
To remove a widget, hover over it and click Edit > Remove.
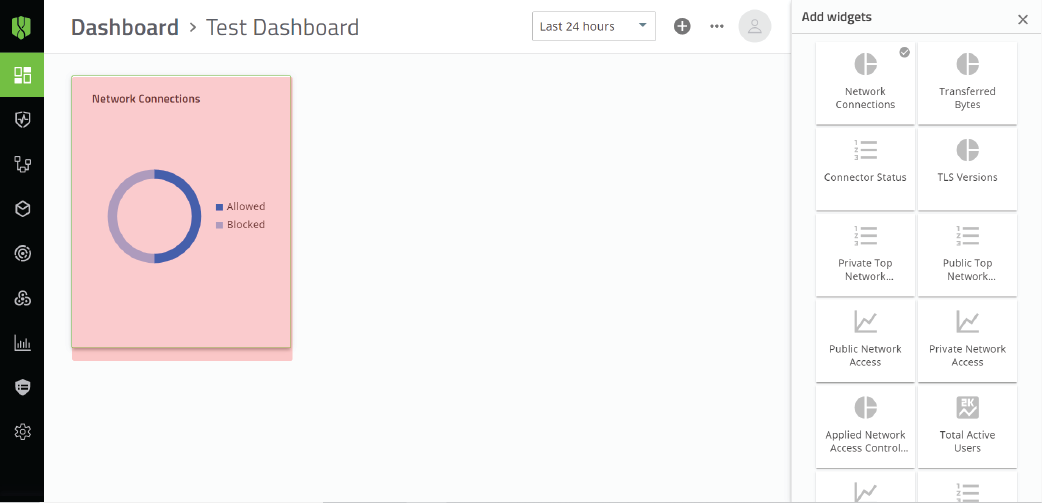
8. Resize the widgets
Click the bottom right corner of the widget and drag it to change the size of the widget. Widgets will be automatically moved around to fit onto the page.
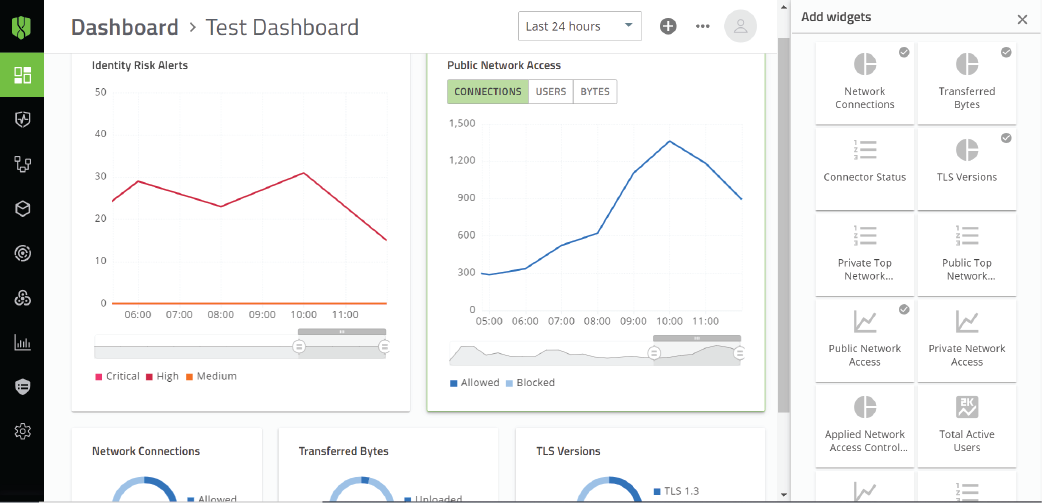
9. Repeat the process to fill up your dashboard
Thats it! You have now successfully created a custom dashboard in the management console.
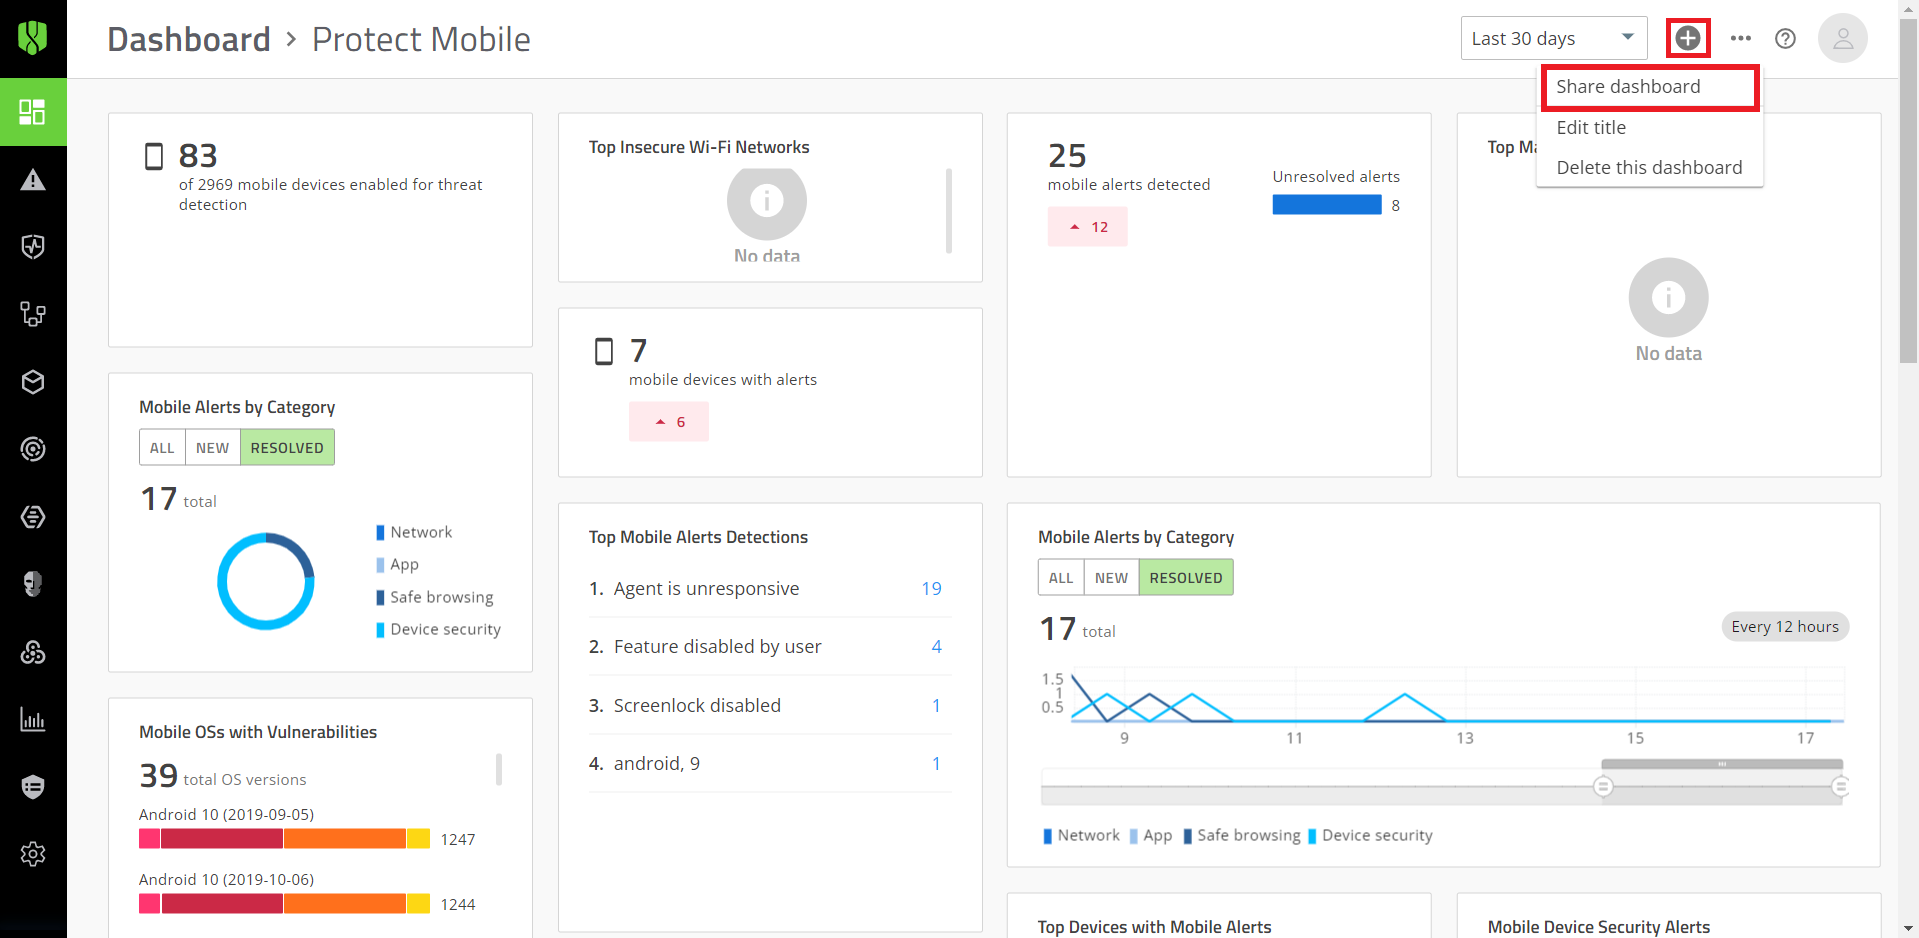
10. To share a dashboard, click + > Share dashboard
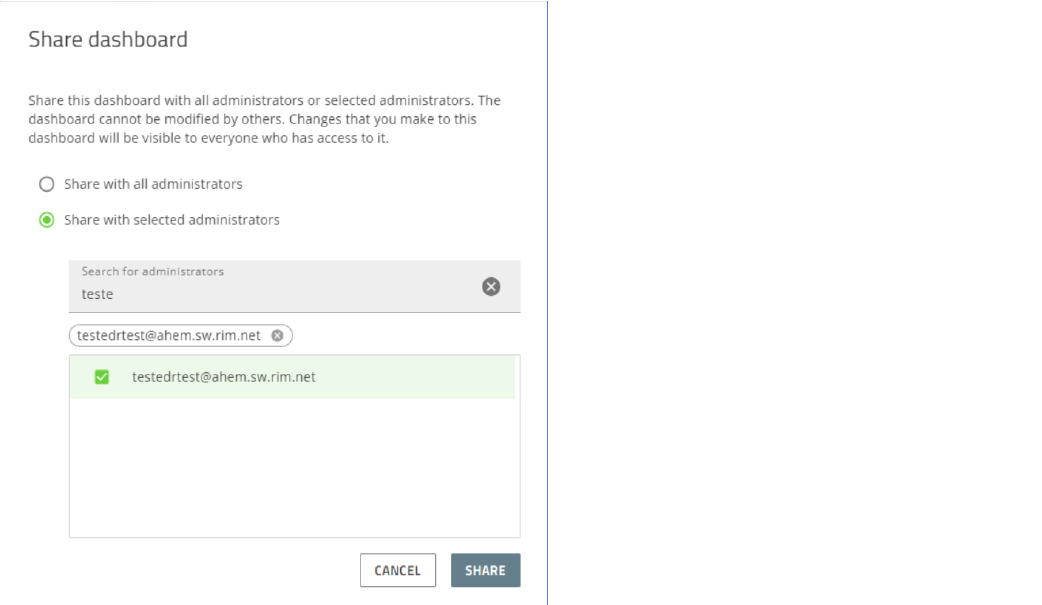
11. Choose who you want to share the dashboard with
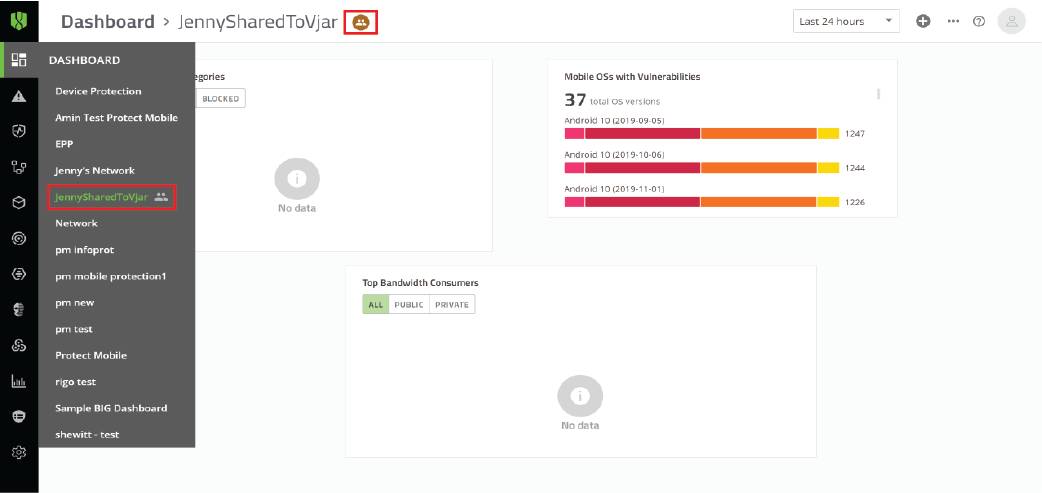
That's it
A shared dashboard can be accessed from the menu bar, click Dashboard > Name of shared dashboard
To learn more about the Cylance Endpoint Security management console and dashboards, see the Cylance Endpoint Security Administration Guide.