Dashboard
The
CylanceGUARD
Dashboard page has an interactive layout that visually displays the various types of alerts that were escalated in your organization, as well as top threats by alert type or target.You can set the timeframe to limit the data that is presented on the dashboard. For example, you can limit the data to the last 24 hours so that you view only a list of escalations that occurred in that timeframe. If you manage multiple child organizations, you can also limit the results to specific organizations. These settings can be found on the top right of the Dashboard page. If there is no data available according to the specified timeframe, the widget will display "No data".
The following dashboard views are available out of the box:
- Executive Summary: This view provides a high level view of the overall protection status and threat landscape, such as visualizations of open and resolved alerts, as well as a map of threat sources.
- Operations: This view provides a quick report of the open escalations and top types of threats allowing users to target high-priority threats and resolve them as soon as possible.
- Threat Summary: This view provides a quick report of the number of incidents, escalated incidents, open escalations, and the top rules that were applied to fewest devices, allowing users to see the effectiveness of their threat strategy and take necessary actions.
Executive Summary dashboard
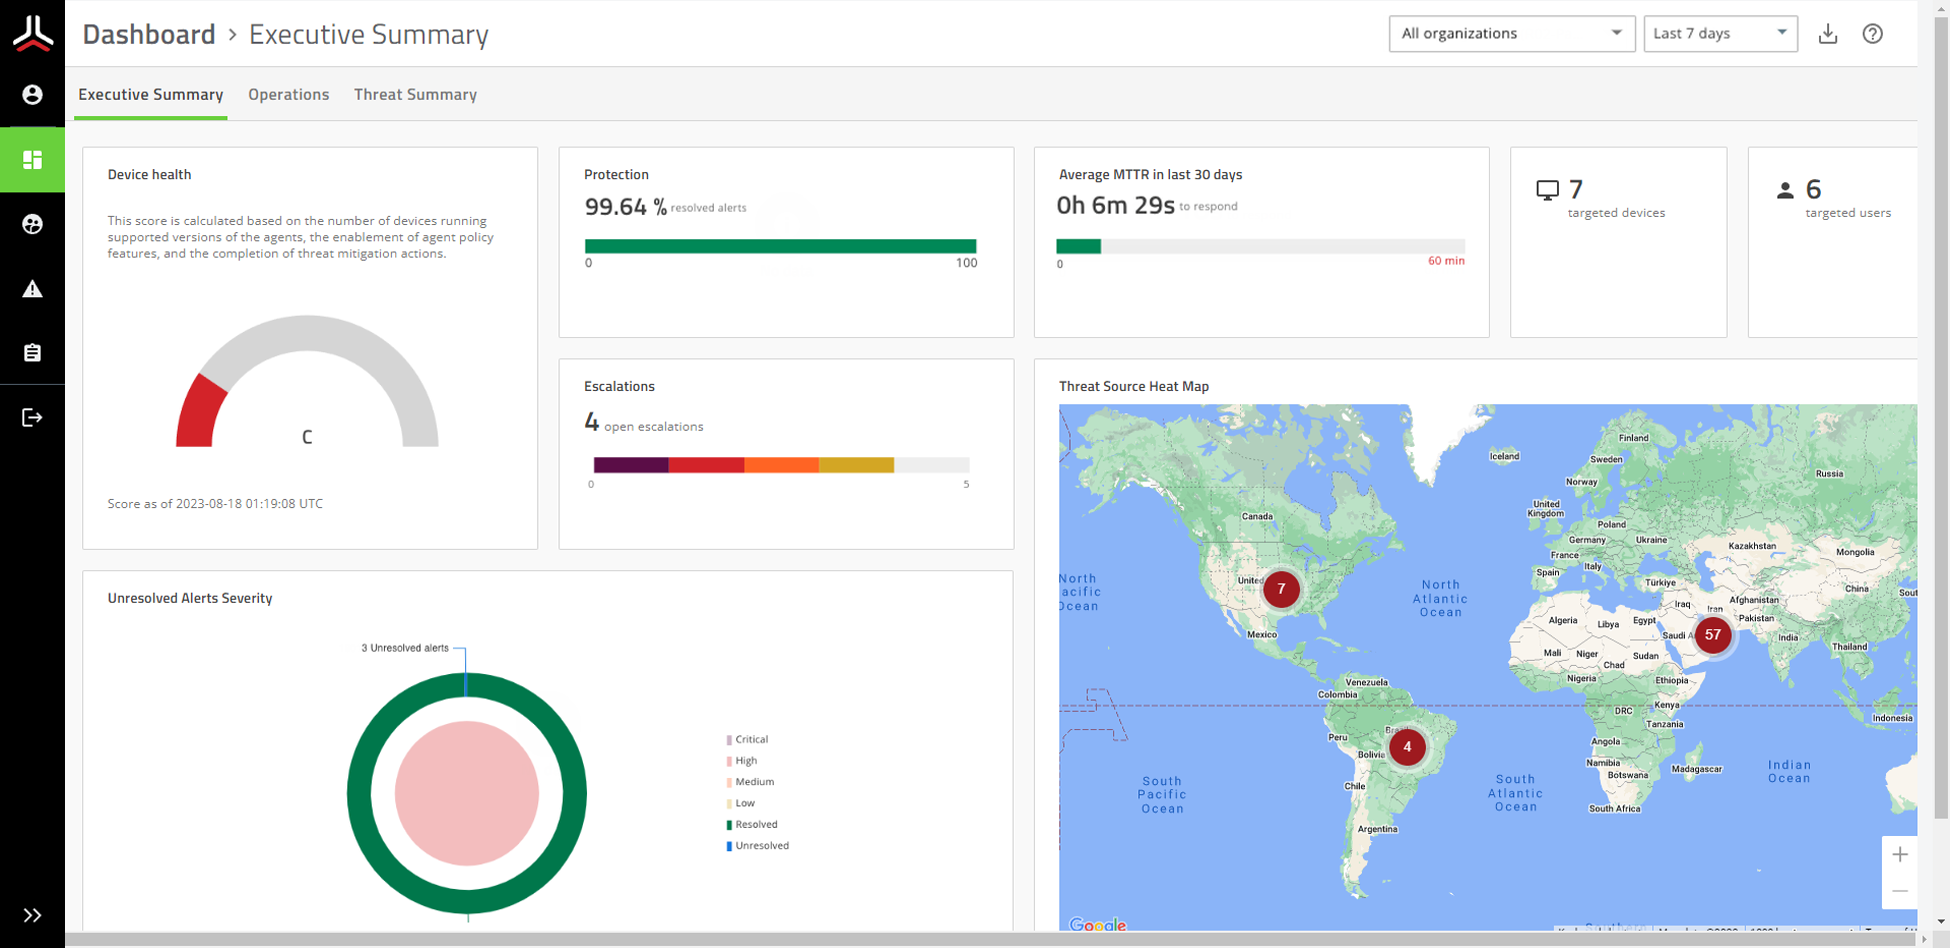
The following alert metrics are displayed in the Executive Summary tab of the dashboard:
- Device health: View a score that is calculated based on the number of devices running supported versions of theCylanceagents, the enablement of agent policy features, and the completion of threat mitigation actions.
- Protection: View the current percentage of alerts that are resolved.
- Escalations: View a graph of escalations to see the ratio of unresolved threats by severity, as well as threats that were already resolved. You can click on parts of this widget to view a list of all open escalations, or view a list of open escalations of a specific severity. Escalations are alerts that are brought to the attention of your organization.
- Average MTTR in last 30 days: View the average time for analysts to escalate and close alerts in the last 30 days.
- Targeted users: View the number of users that were targeted.
- Targeted devices: View the number of devices that were targeted.
- Unresolved Alerts Severity: View a graph that shows the status of overall alerts by severity. At a glance, you can see the ratio of resolved and unresolved alerts. Unresolved alerts are incoming alerts thatCylanceGUARDanalysts are working on that may or may not be escalated to your organization for attention.
- Threat Source Heat Map: View a map of threat sources to understand where attacks are originating from. You can click the numbers that appear on the map to see the severity of threats for each geographic area.
Operations dashboard
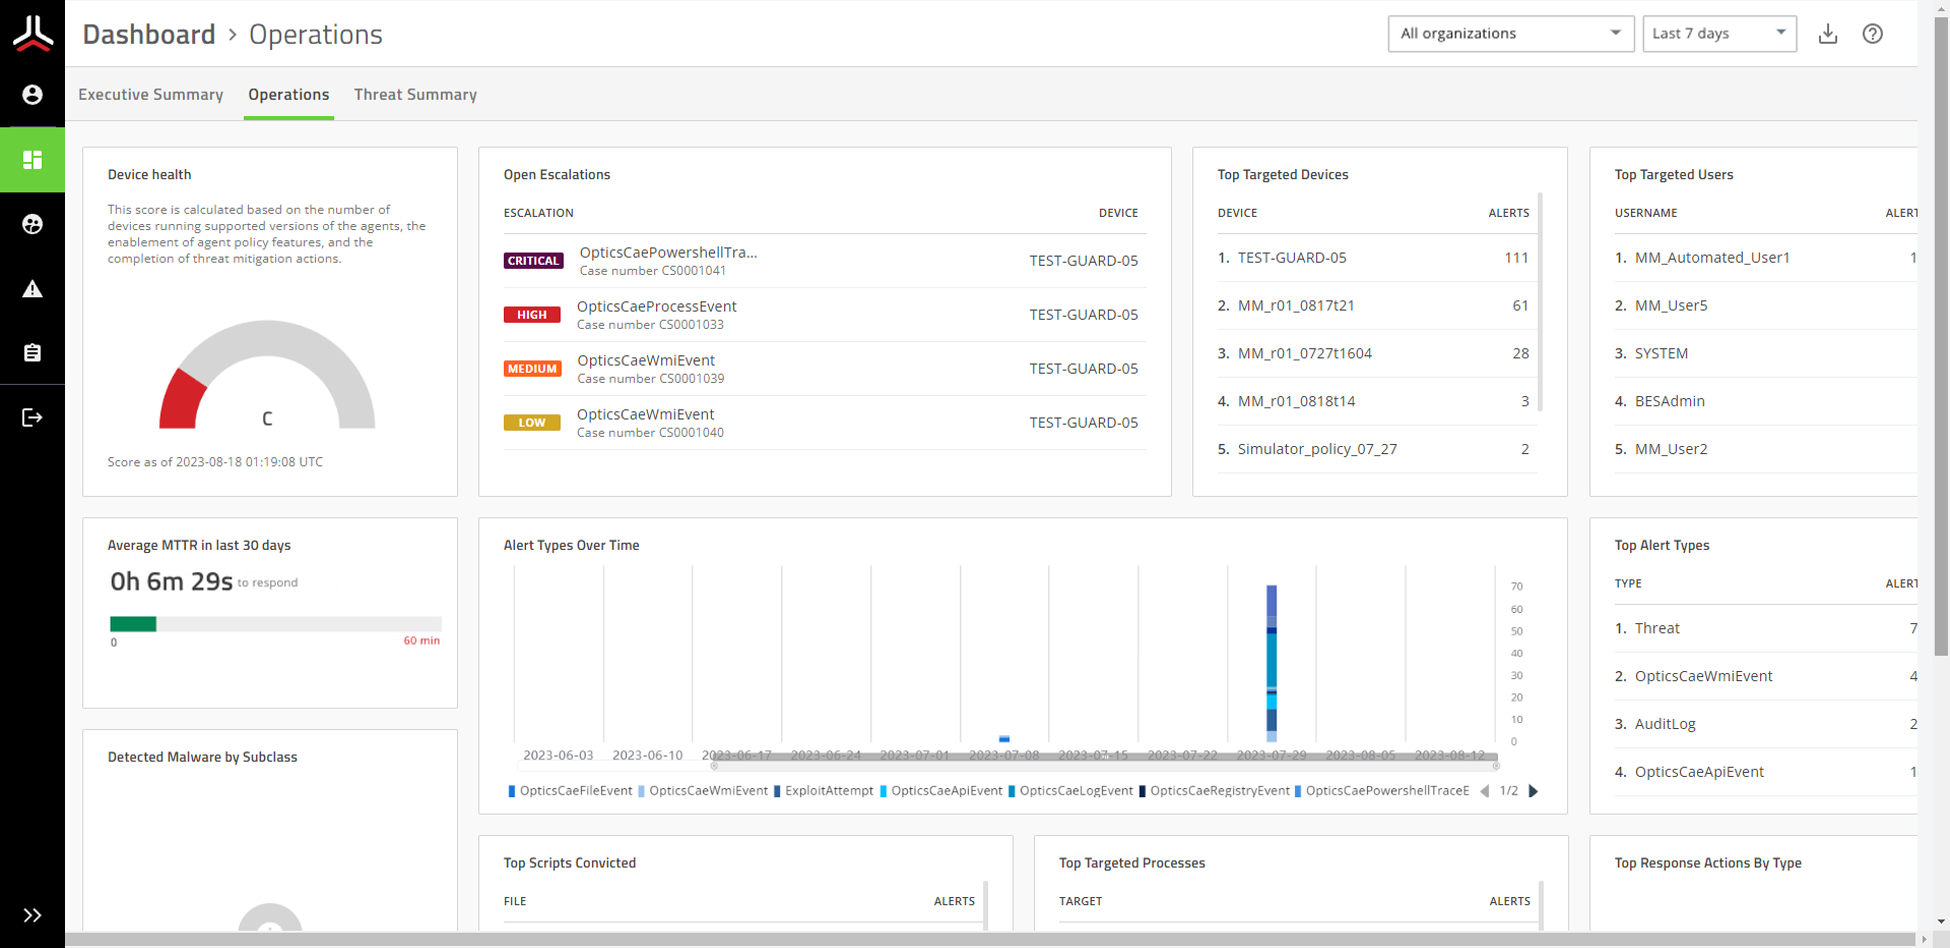
The following alert metrics are displayed in the Operations tab of the dashboard:
- Device health: A score that is calculated based on the number of devices running supported versions of theCylanceagents, the enablement of agent policy features, and the completion of threat mitigation actions.
- Average MTTR in last 30 days: View the average time for analysts to escalate and close alerts in the last 30 days.
- Open Escalations: View a list of open escalations that might require your attention, such as those with critical and high severity. You can click on an alert to quickly jump to its details.
- Top Alert Types: View the top alert types to see the alert types (such as memory exploit attempts, script control threats, and network threats) that are reported most frequently in your organization.
- Detected Malware by Subclass: View the top malware types by subclass, such as whether a threat was a trojan, virus, or worm.
- Top Scripts Convicted: View the top scripts to see the scripts that are run the most often in your organization that are also generating alerts. Hover over a script in the list to see the full directory path to the script.
- Alert Types Over Time: View the top alert types that have occurred over a period of time. You can adjust the timeframe by sliding the bar below the x-axis and click the alert types to show or hide them in the graph.
- Top Targeted Processes: View the top targeted processes to see the processes that are most often targeted by threats.
- Top Targeted Devices: View the top targeted devices to see the devices that are generating the most alerts.
- Top Targeted Users: View a list of users that have encountered the most threats.
- Top Response Actions By Type: View a list of the top response actions that were used to resolve threats.
Threat Summary dashboard
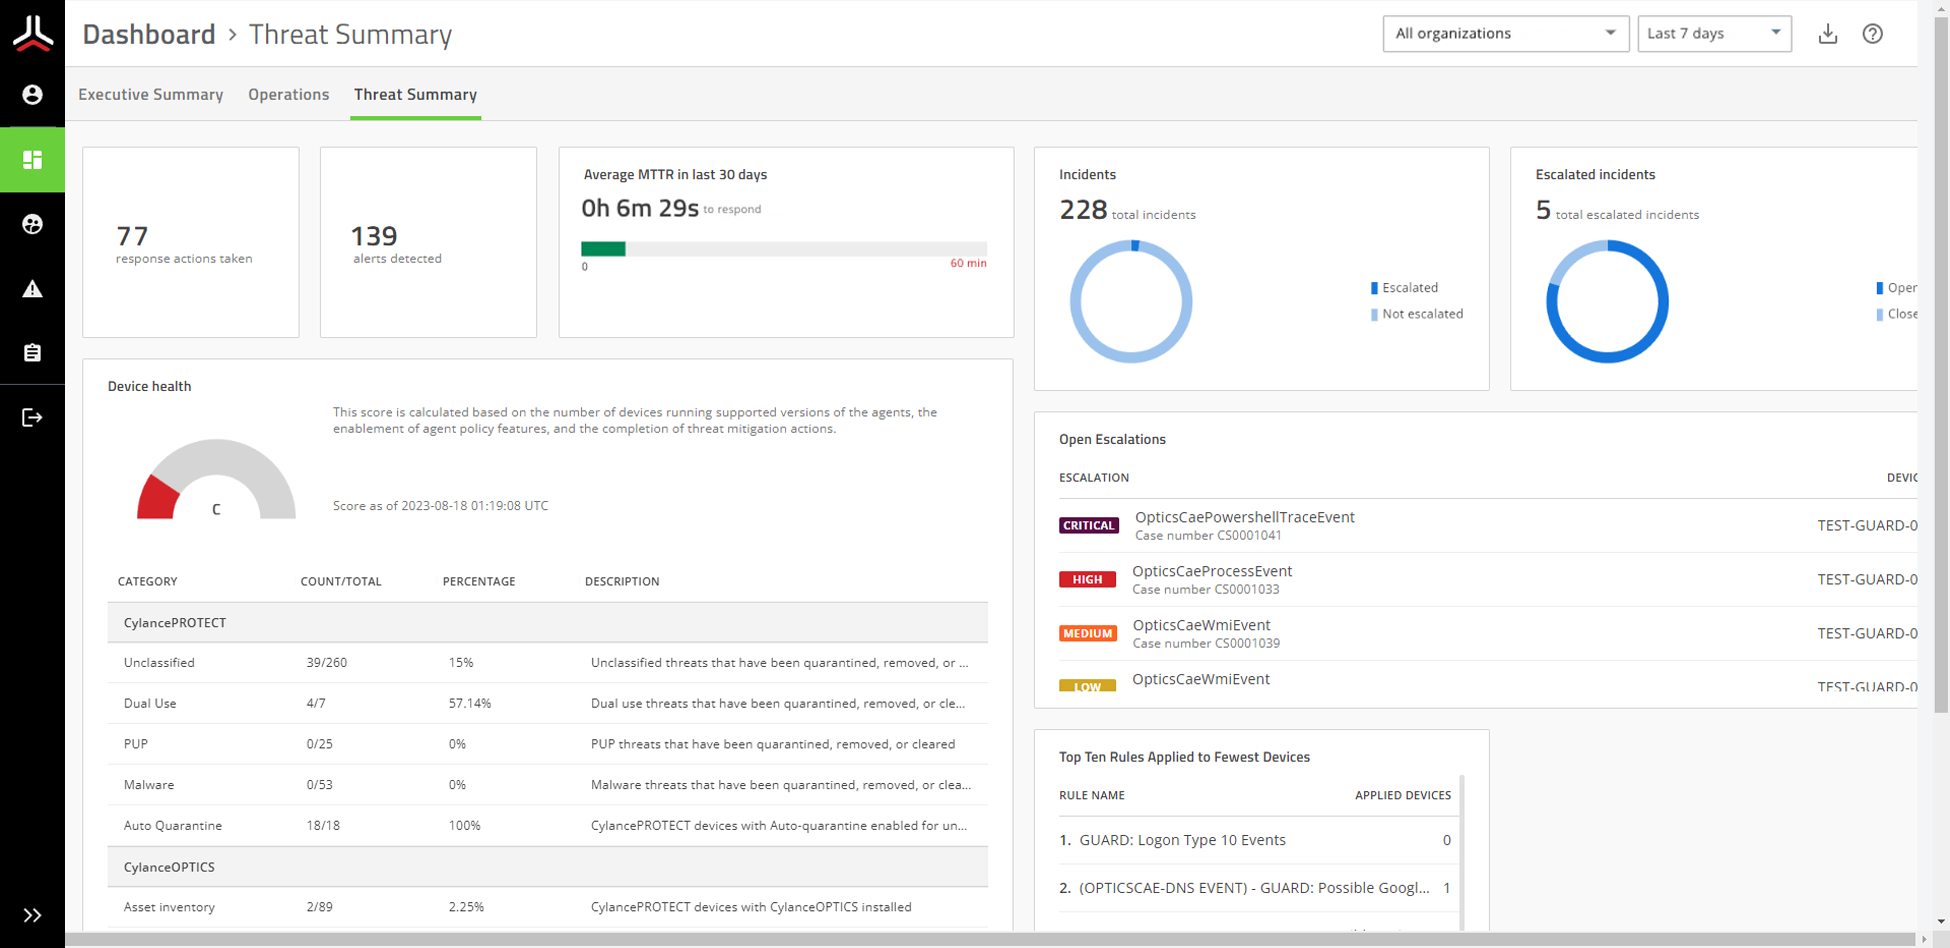
The following alert metrics are displayed in the Operations tab of the dashboard:
- Response actions taken: The number of actions taken within the specified timeframe.
- Alerts detected: The number of alerts detected within the specified timeframe.
- Average MTTR in last 30 days: View the average time for analysts to escalate and close alerts in the last 30 days.
- Incidents: View the total number of incidents that were escalated and not escalated.
- Escalated incidents: View a list of incidents that were recently escalated.
- Device health: A score that is calculated based on the number of devices running supported versions of theCylanceagents, the enablement of agent policy features, and the completion of threat mitigation actions.
- Open Escalations: View a list of open escalations that might require your attention, such as those with critical and high severity. You can click on an alert to quickly jump to its details.
- Top Ten Rules Applied to the Fewest Devices: View a list ofCylanceOPTICSrules that were applied to the fewest devices.