The escalations page gives you details about the events detected by the CylancePROTECT and CylanceOPTICS agents on users’ devices. You can use this page to review and manage the alerts.
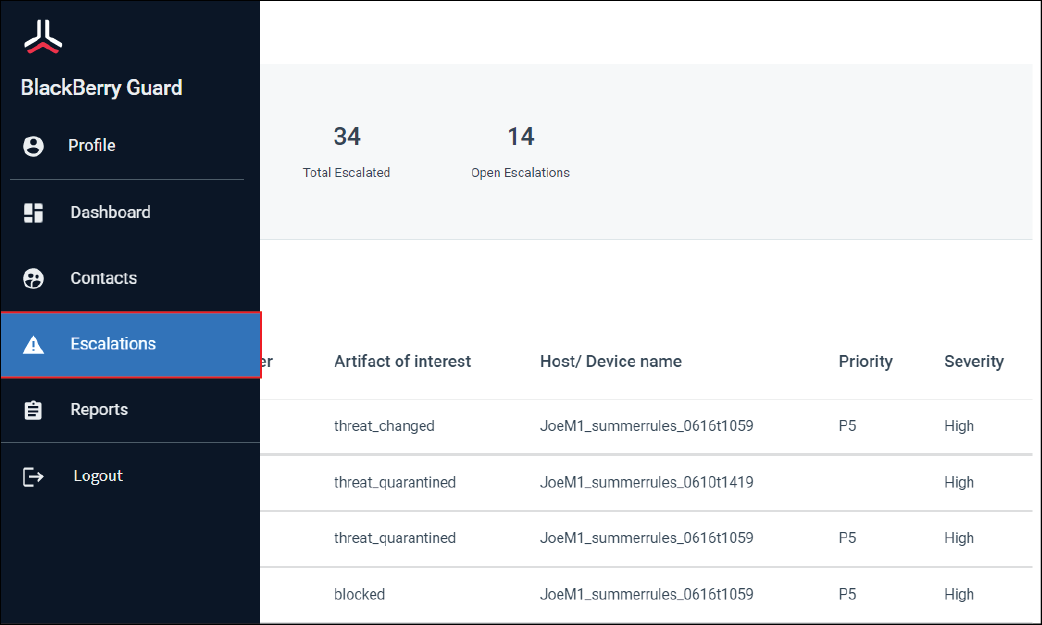
1. Click Escalations
On the escalations page, you can use the search field to filter the alerts.
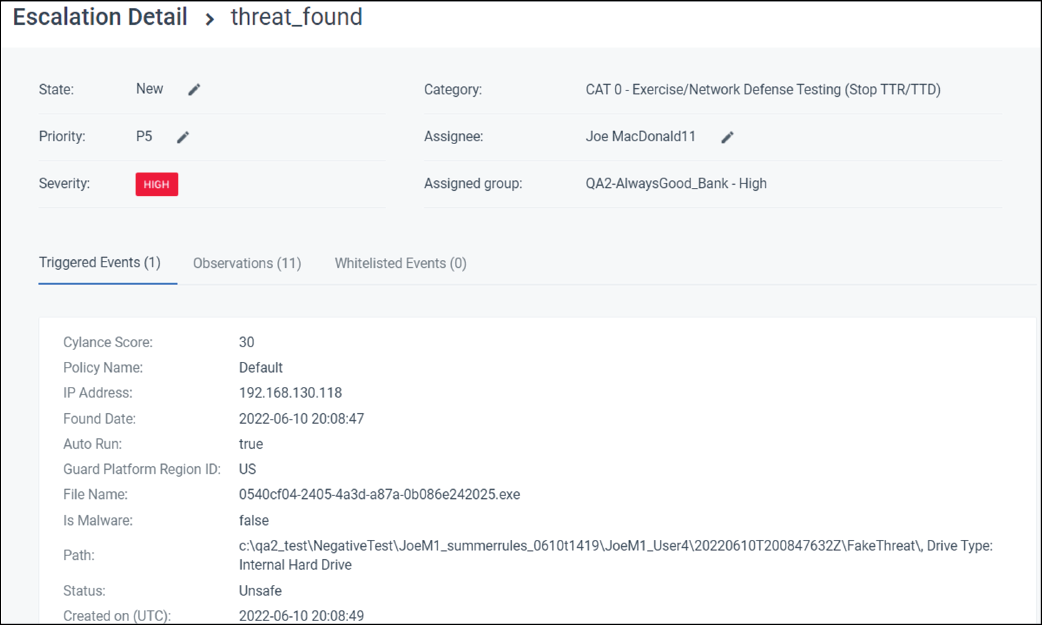
2. Click an alert to view details
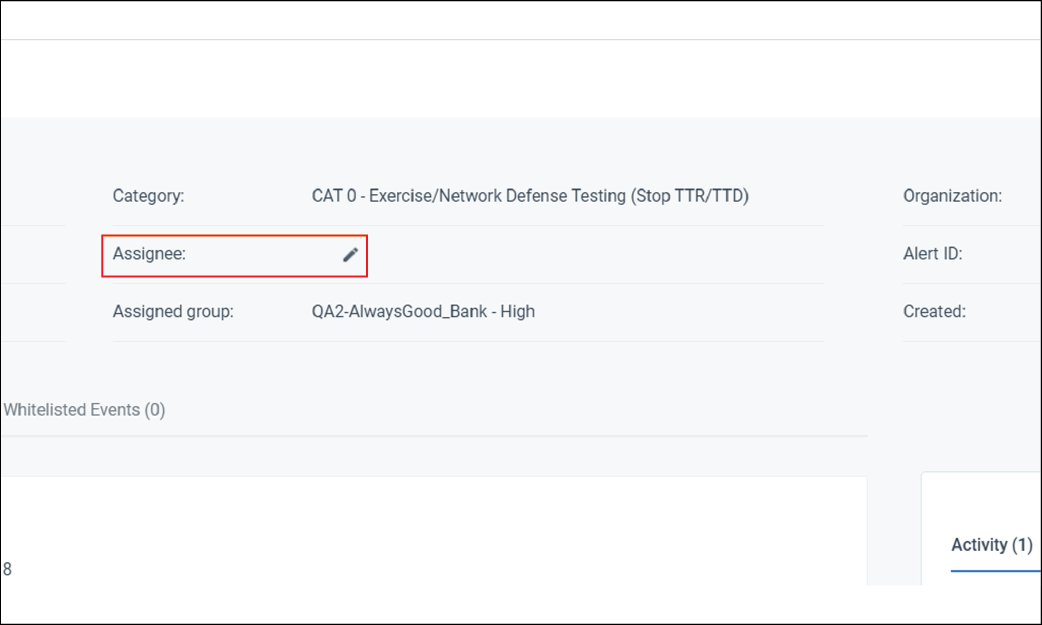
3. Assign the alert to yourself
Taking ownership of an alert lets others know that someone is already investigating it.
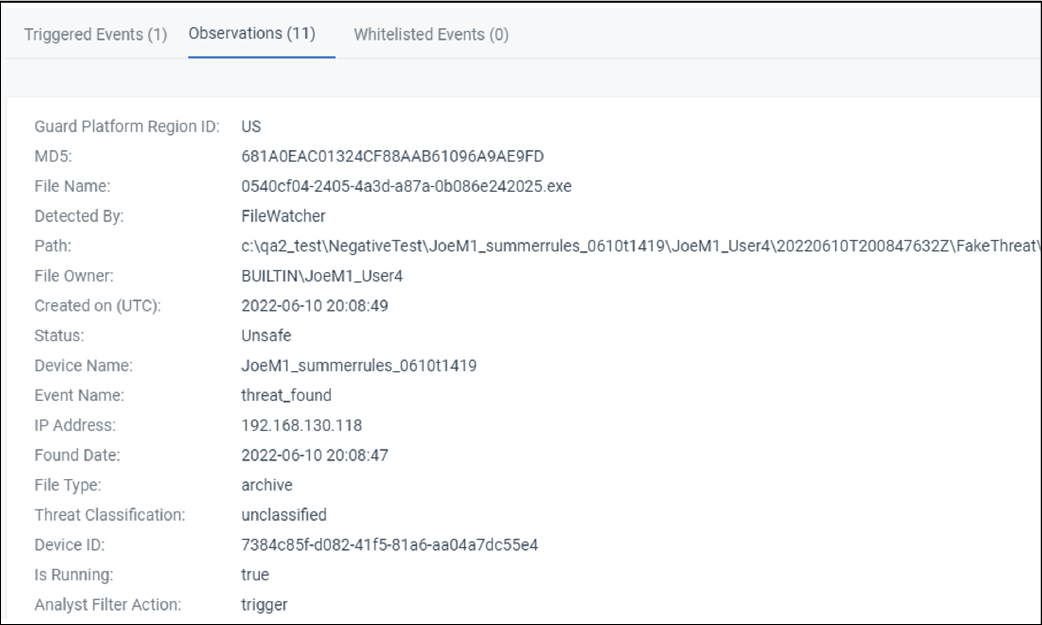
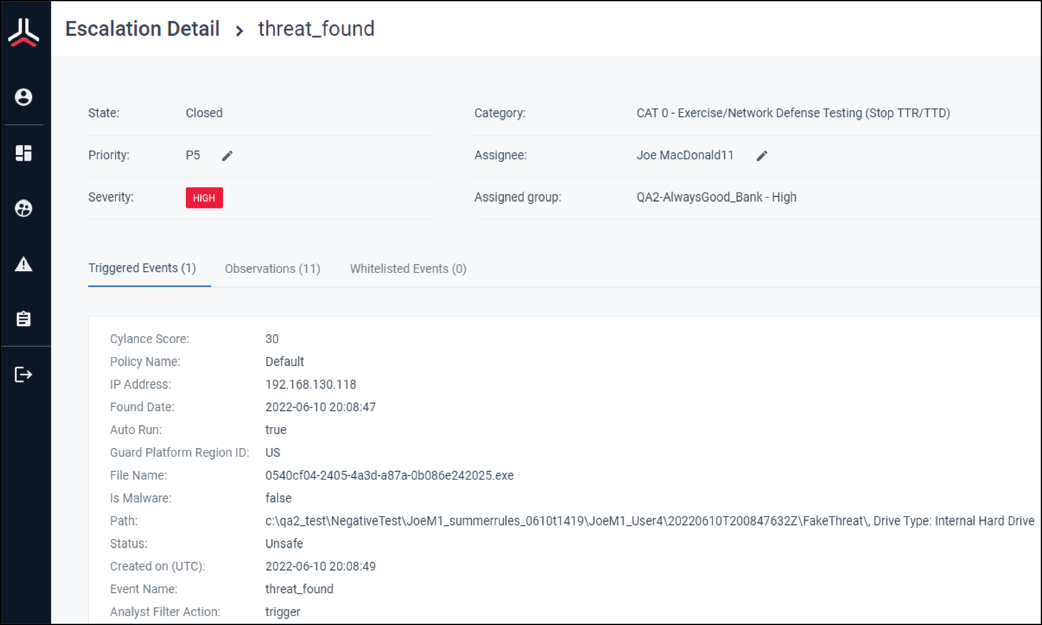
4. Review and investigate the alert
You can read through the trigger events and comments for information about the alert. Use this information to investigate and determine whether it was expected or unexpected behavior.
For example, a CylanceGUARD analyst may have left a comment asking you to verify suspicious activity such as, “We have seen a PowerShell script running on System A that is connecting to the following IP address, is this behavior expected on this system?"
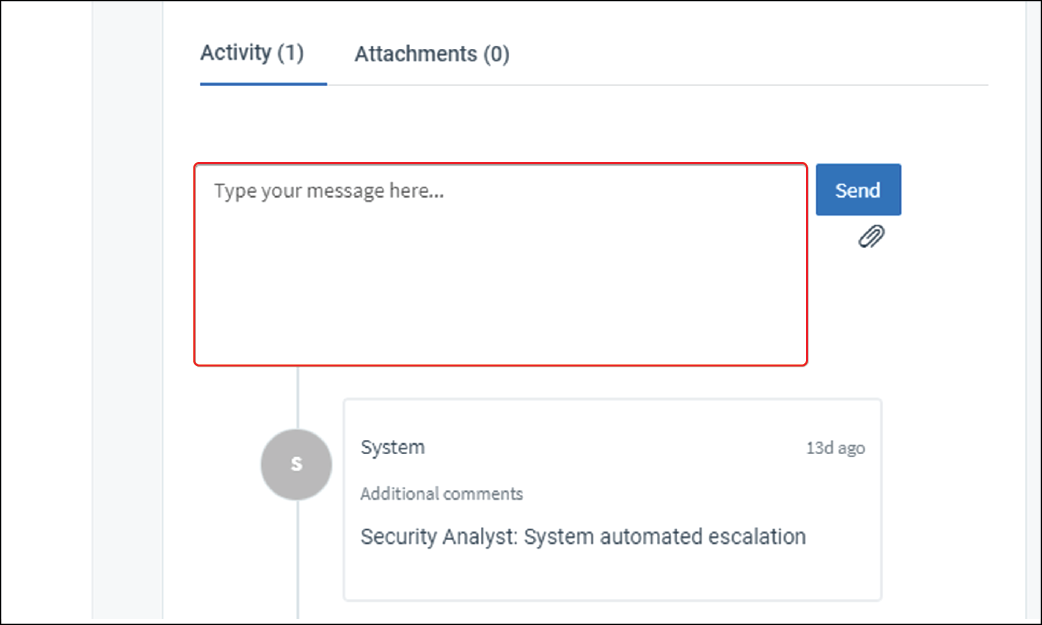
5. Add comments
You can use the comment box to share or request information and communicate any actions or next steps.
For example, if this is expected behavior, add a comment to inform the CylanceGUARD analyst so that they can take action in the console to exclude this alert in the future.
If this is unexpected behavior, communicate any actions, next steps, and if you need an incident response team such as BlackBerry Security Services.
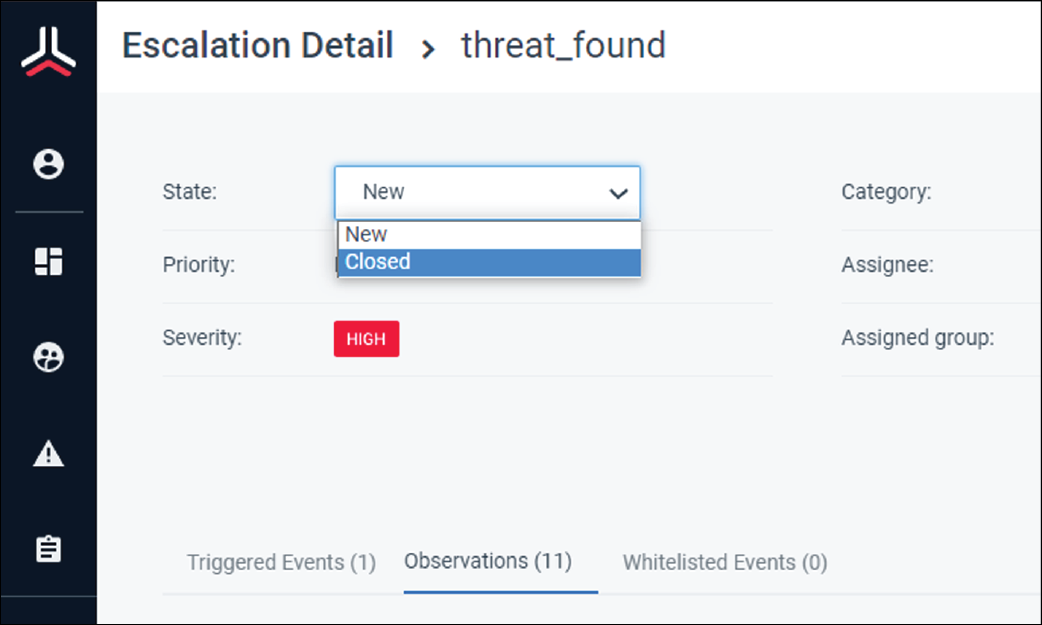
6. Close the alert
Set the state of the alert to Closed and click Save.
After the case is closed, it can't be reopened.
7. That's it!
You have successfully handled an escalation in CylanceGUARD.
For more information about handling escalations in CylanceGUARD, see Escalations in the CylanceGUARD User Guide.