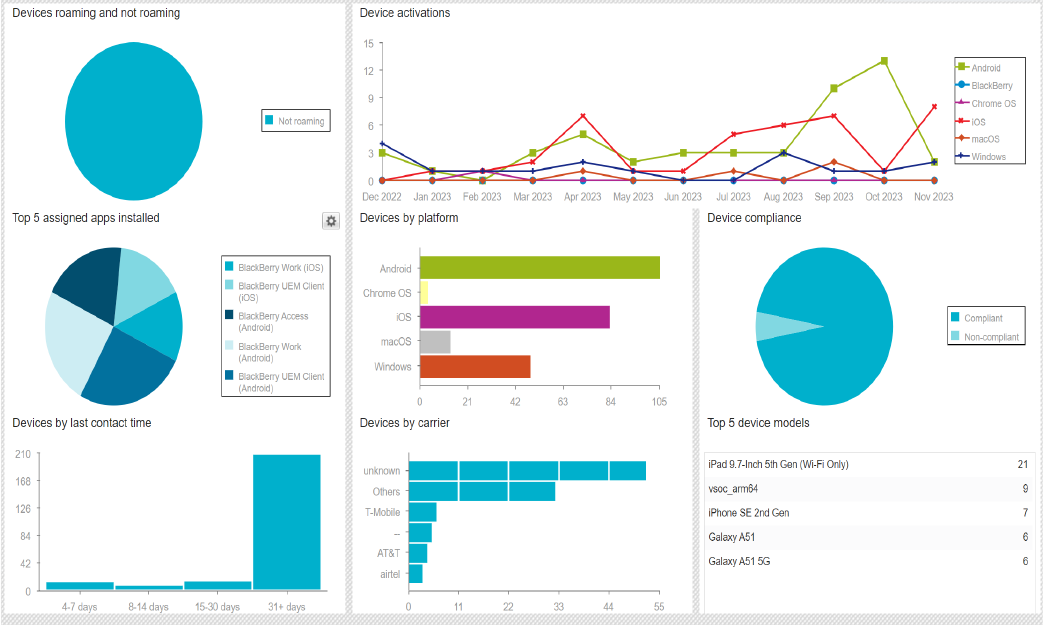
Dashboard reports in the UEM management console use graphs to present information about users and devices. There are 8 dashboard reports that provide useful information about your UEM environment. You can export report data as a .csv file for further analysis. You can also change the type of graph that is used to visualize the data.
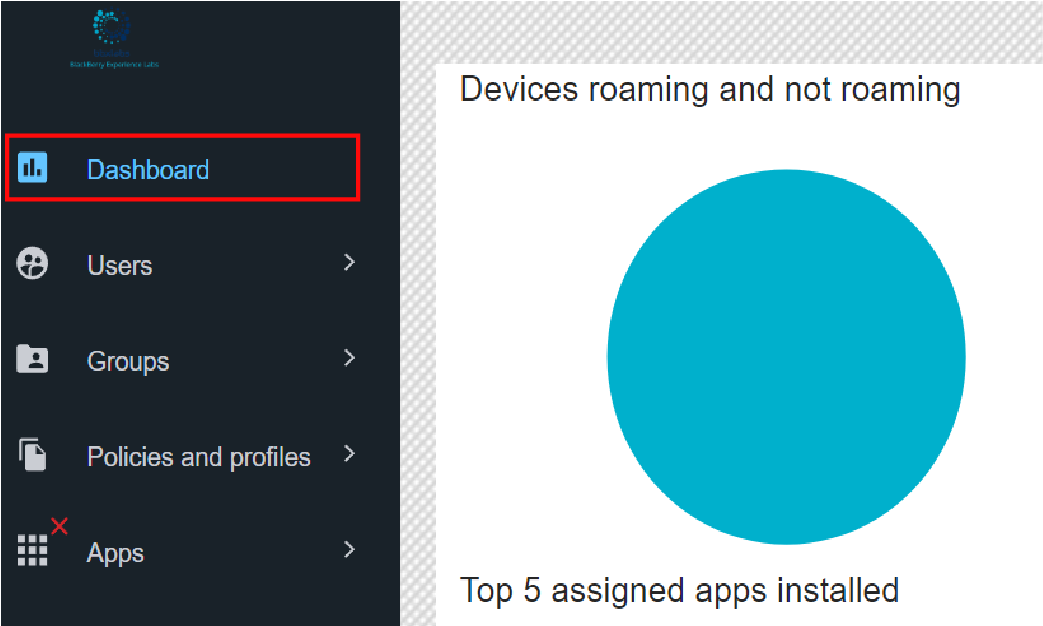
On the menu, click Dashboard.
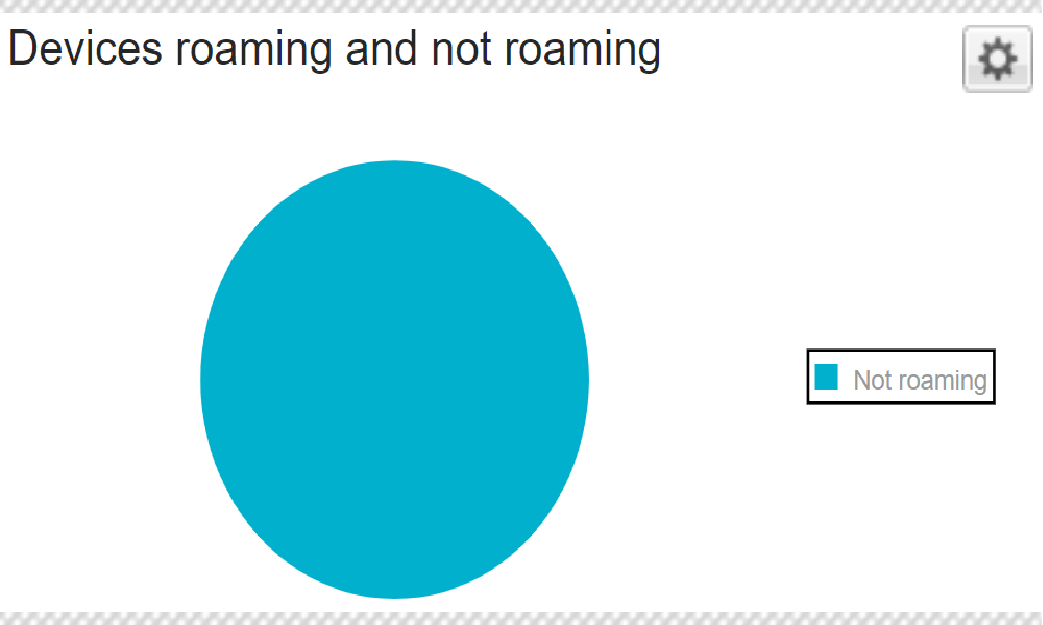
Device roaming and not roaming.
You can see how many devices are currently in a roaming state.
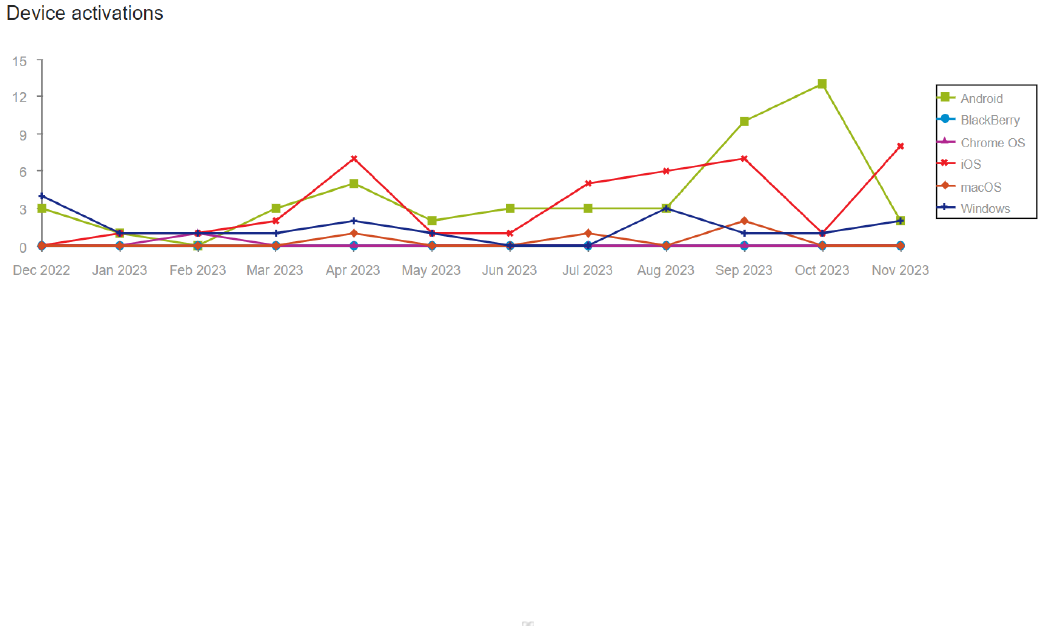
Device activations.
You can see the number of devices activated over a 12-month period.
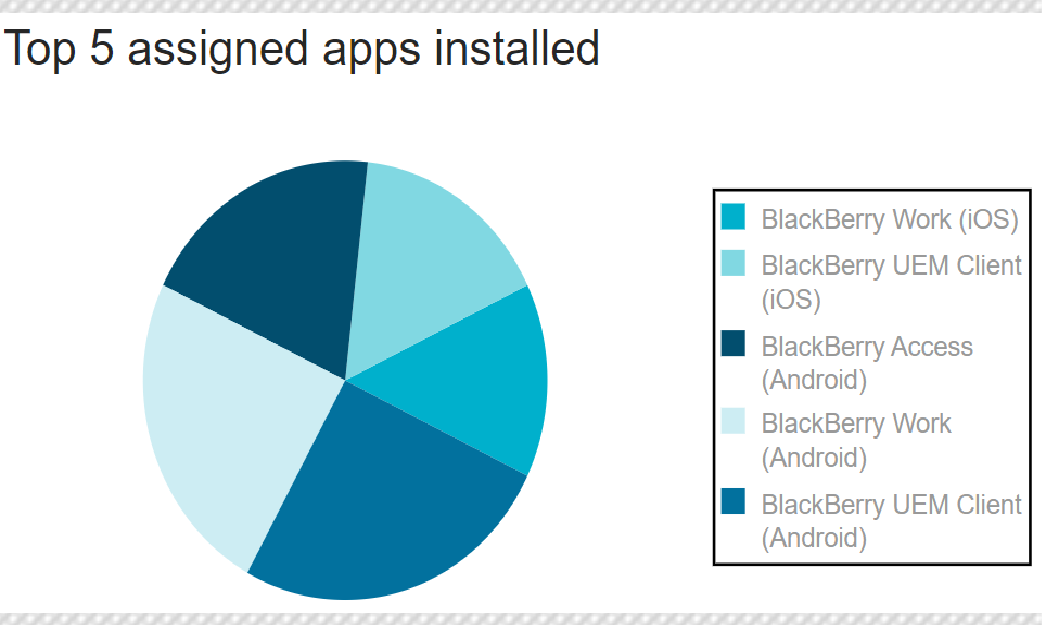
Top 5 assigned apps installed.
You can see the most common apps installed on devices.
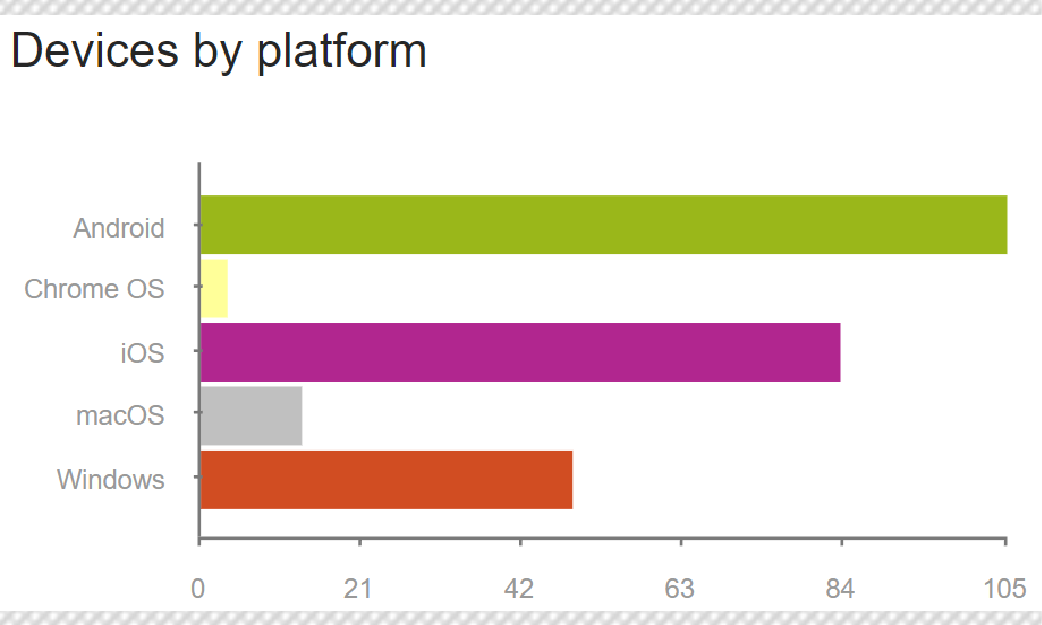
Devices by platform.
You can check what platforms the devices in your organization use.
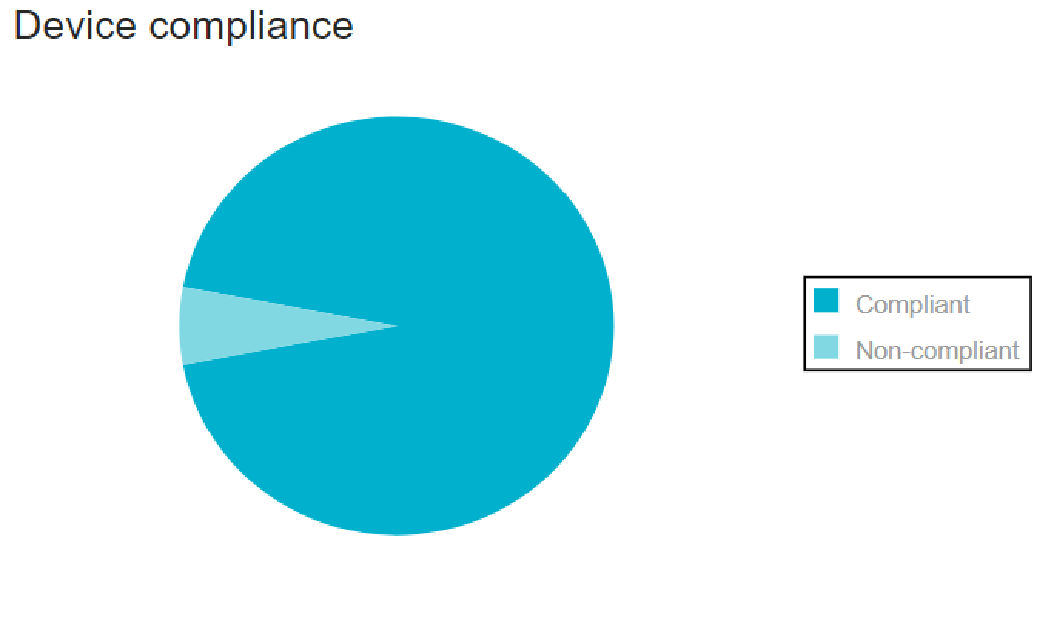
Device compliance.
You can see a visual breakdown of how many devices are compliant and non-compliant.
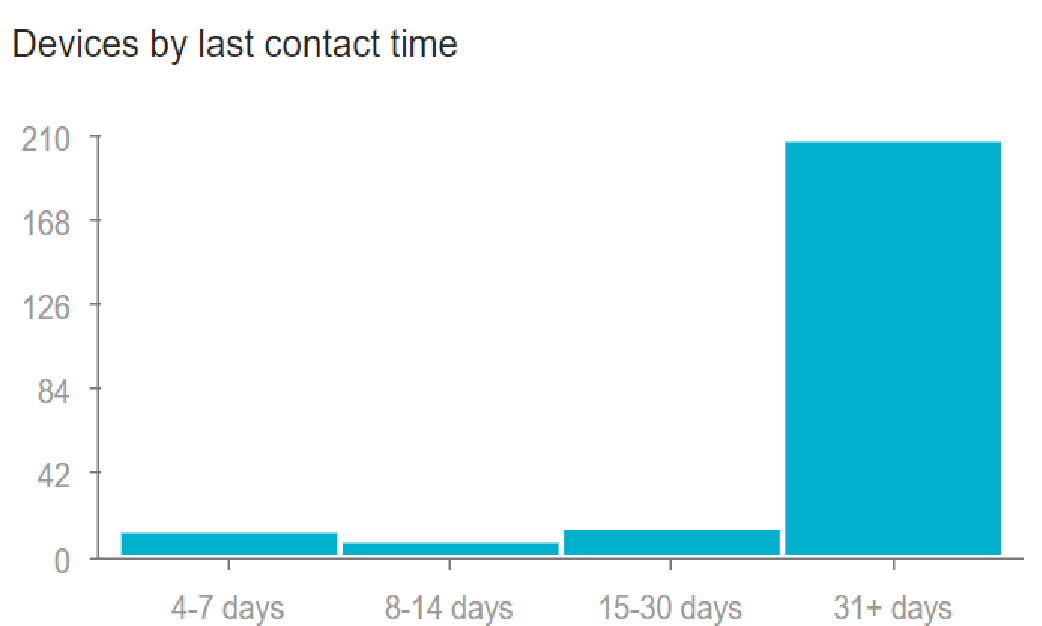
Devices by last contact time.
You can see how many days have passed since devices last contacted the UEM server.
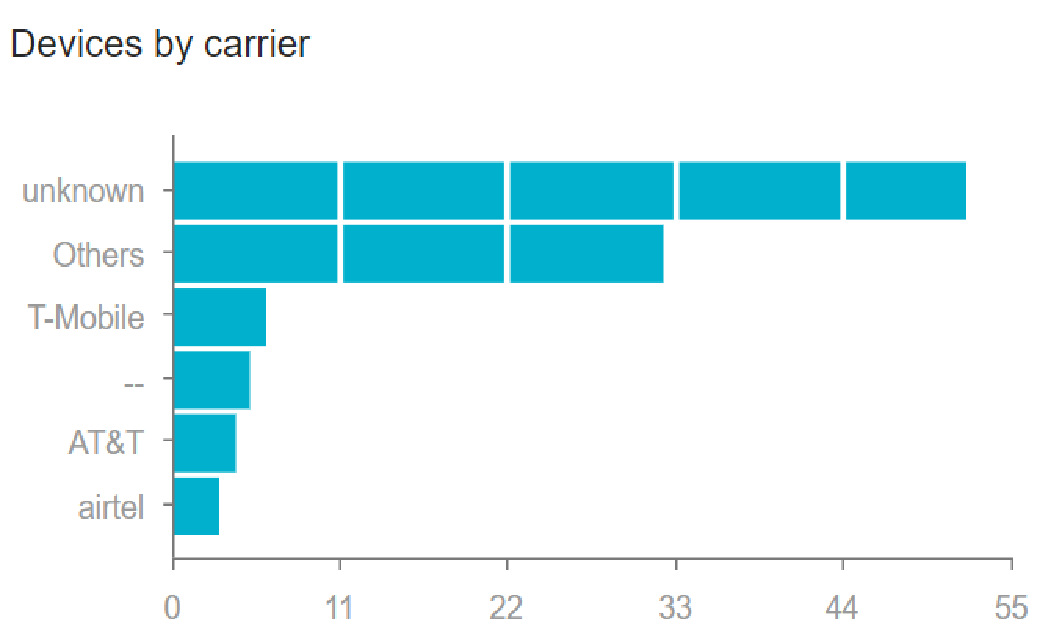
Devices by carriers.
You can see a breakdown of devices by service provider.
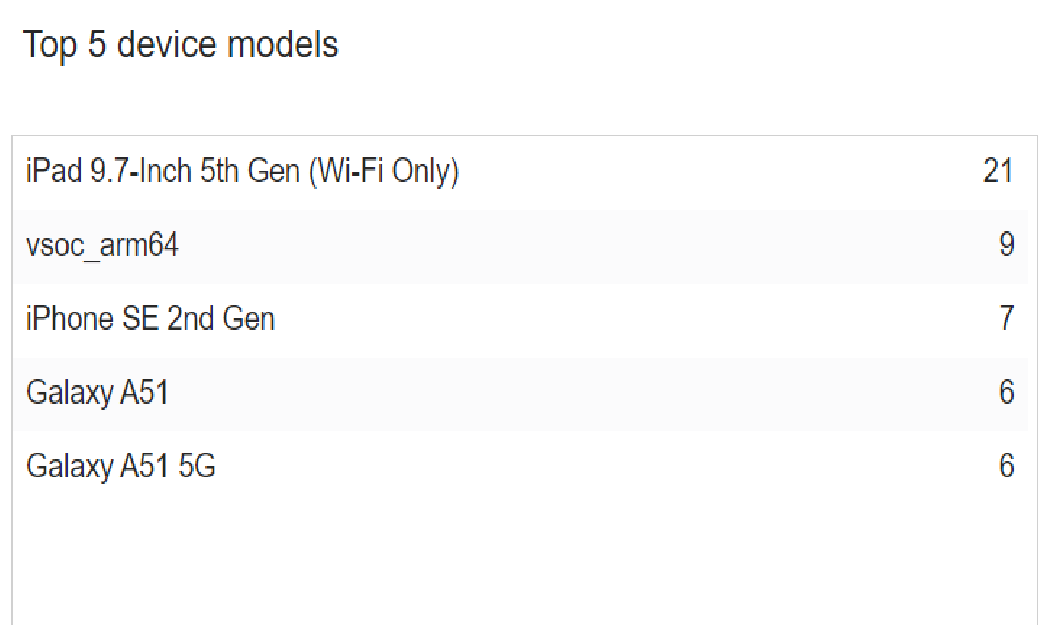
Top 5 device models.
You can check what the most common device models are in your organization.
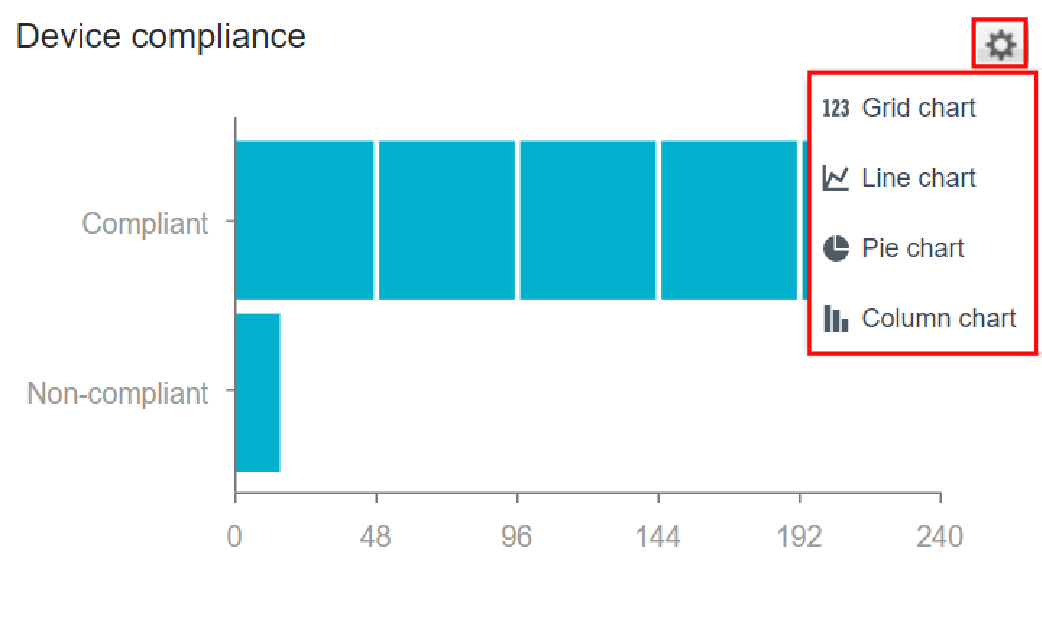
Change the type of graph.
Click the settings icon beside a graph and select a chart type from the drop-down list.
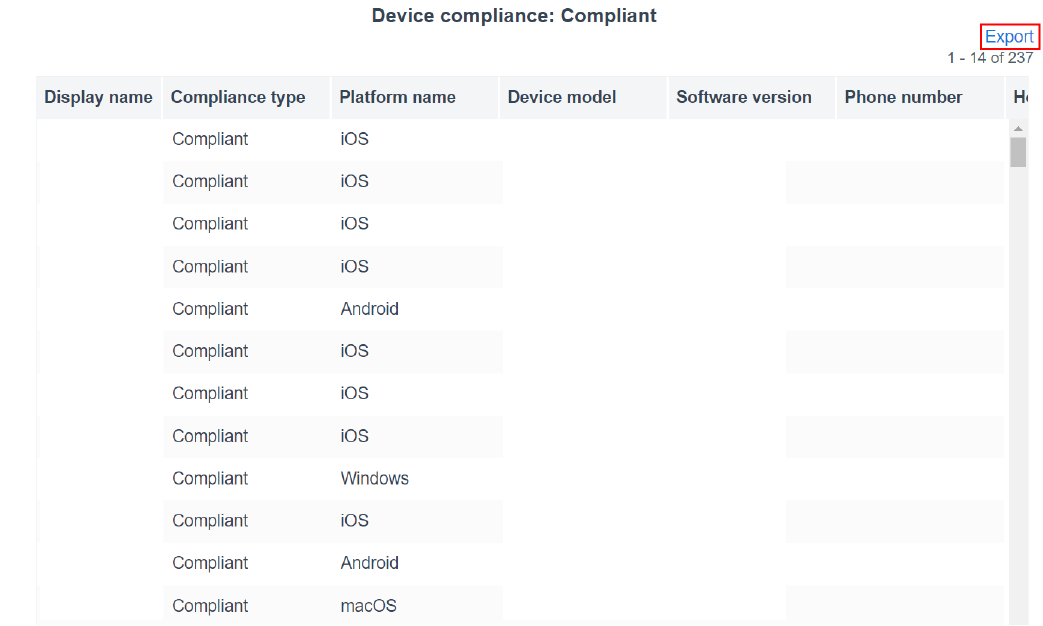
Export dashboard report to a .csv file.
Click a graph to open a report and click Export.
That’s it!
Now you know how to use the dashboard to monitor your UEM environment.
For more information about using dashboard reports and the information displayed by each report, see Using dashboard reports.